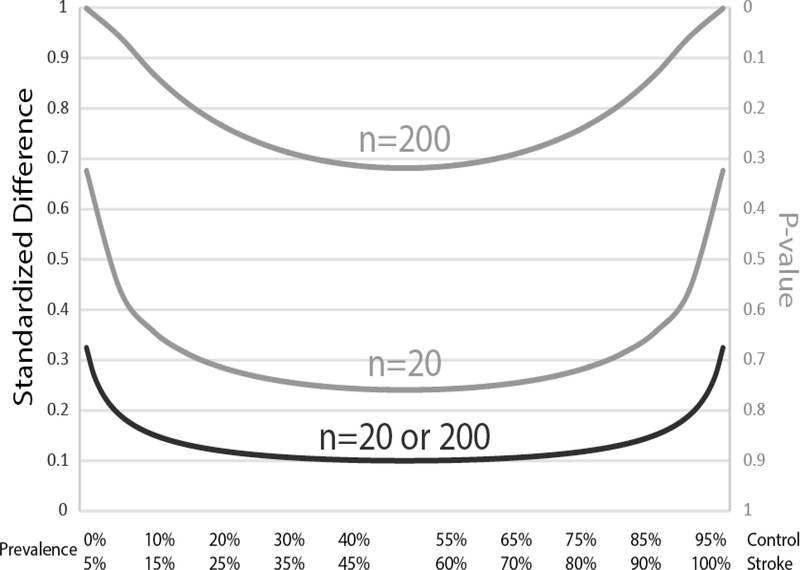
Figure 1.
Standardized difference (black, left y-axis) and P-values (gray, right y-axis) for a hypothetical matching variable with a 5% difference in prevalence between the control and stroke cohorts. A standardized difference < 0.1 or a P-value > 0.05 are generally reported as evidence for good matching between groups. The P-value, however, changes dramatically based on sample size such that a small study with 20 participants produces P-values much larger than a study with 200 participants. In contrast, for the same difference in prevalence between groups, the standardized difference remains the same whether there are 20 or 200 participants. Thus, the standardized difference is the preferred method to report match fidelity between variables. With either method, variables that are either over- or underrepresented in the population require more stringent matching.

