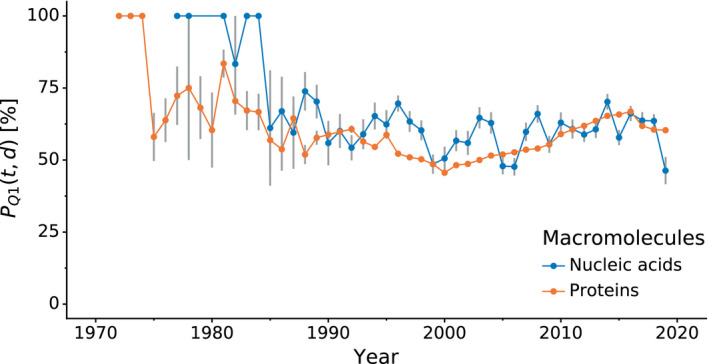
Fig. 2.

Comparison of PQ 1(t,d) of protein and nucleic acid structures over time. Variation in mean PQ 1(t,d) quality percentile (y‐axis, higher is better), comparing nucleic acid and protein structures (color) over time (x‐axis). Error bars indicate estimated unbiased standard errors of the mean.
