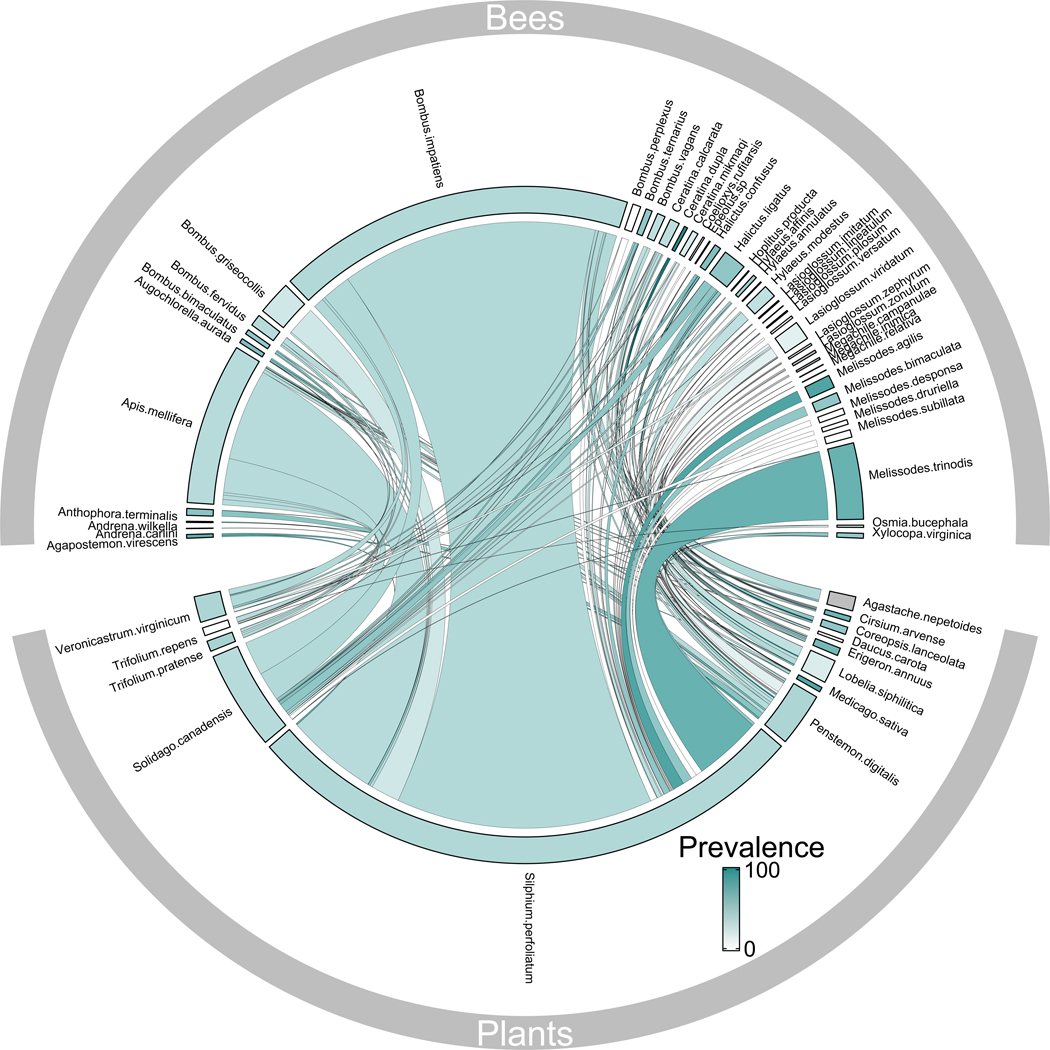
Fig. 1. Pathogen prevalence is widespread in plant-pollinator networks.
Composite quantitative bipartite network of f3"interactions (links) between bees (top bars) and flowers (bottom bars). Width of bars reflects relative abundance of bees and flowers, and width of links indicates interaction frequency. Color intensity of bars indicates pathogen prevalence in bees and on flowers (links colored according to prevalence in bees). Gray bars indicate species that were not screened. At least one screened pathogen (trypanosomes, neogregarines, Nosema ceranae, and Nosema bombi) was present in 65% of bee species and 75% of flower species. There were 42 bee species in the resolved network and 28 bee morphogroups in the unresolved network. Fig. S3 provides pathogen-specific depictions of prevalence across networks.

