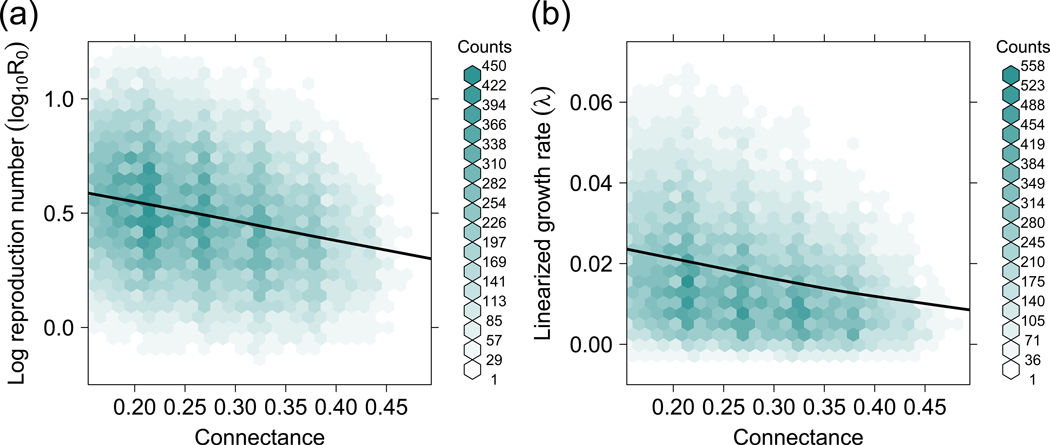
Fig. 3. (a) Connectance reduces pathogen reproductive number (R0).
Based on results from a SIS model run on 100,000 random networks of varying connectance. (b) Connectance reduces pathogen linearized prevalence growth rate (λ). Results from a SIS model run on 100,000 random networks of varying connectance show that λ decreases with increasing connectance. Lower R0 and λ imply lower pathogen prevalence during the early stages of an outbreak. The solid line is a smoothing curve fitted through median values of R0 and λ for each connectance bin.

