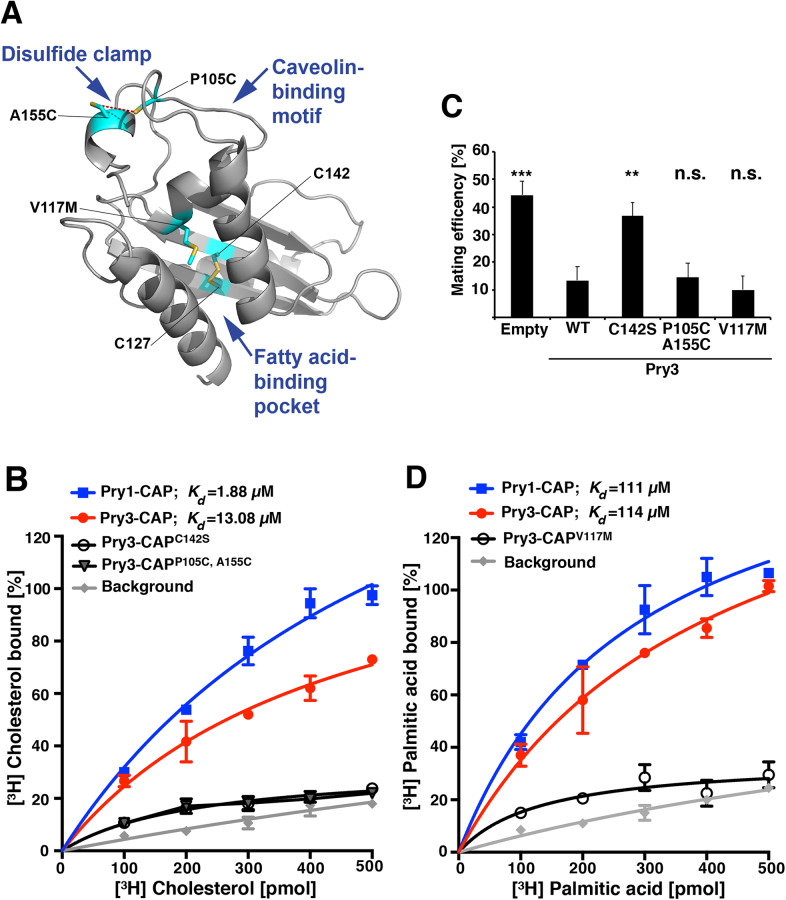
Fig. 3.
Mating inhibition by Pry3 is independent of its lipid-binding function. (A) Structural model of the CAP domain of Pry3 showing residues important for sterol- and fatty acid-binding. The simultaneous exchange of proline 105 and alanine 155 to cysteine (P105C, A155C) is expected to result in a disulfide bridge that clamps down the flexibility of the loop containing the caveolin-binding motif and thus to prevent sterol binding. Exchange of valine 117 to methionine obstructs the fatty acid binding pocket. Mutation of cysteine 142 to serine, will affect the disulfide bridge that connects two antiparallel β-sheets (β3 and β4). (B) The CAP domain of Pry3 binds cholesterol in vitro and this is abrogated by a mutation in the CAP domain, Pry3-CAPP105C, A155C. Polyhistidine-tagged versions of the CAP domain of Pry1, Pry3 and mutant versions of Pry3, Pry3-CAPC142S and Pry3-CAPP105C, A155C were expressed in E. coli, purified and binding of [3H]cholesterol was measured. Binding of the radioligand is plotted and the deduced Kd is indicated. Background binding was determined in an assay lacking protein. (C) Mating inhibition by Pry3 is independent of the lipid-binding function of the CAP domain. Mating efficiency was calculated for cells containing an empty plasmid, a plasmid with a wild-type version of Pry3, or the mutant forms of Pry3: Pry3C142S, Pry3P105C, A155C, or Pry3V117M. Values represent means±s.d. of four independent determinations. Asterisks denote statistical significance compared to cells overexpressing wild-type (WT) Pry3 (Welch t-test; **P-value <0.01; ***P-value<0.001; n.s., not significant). (D) The CAP domain of Pry3 binds fatty acids in vitro and this binding is abrogated by the V117M mutation. Polyhistidine-tagged versions of the CAP domain of Pry1, Pry3 and the Pry3-CAPV117M mutant version were purified from E. coli, and binding of [3H] palmitic acid was measured. The concentration-dependent binding of the radioligand is plotted and the Kd is indicated. Values in panels B and D represent means±s.d. of two independent binding assays.

