Fig. 5.
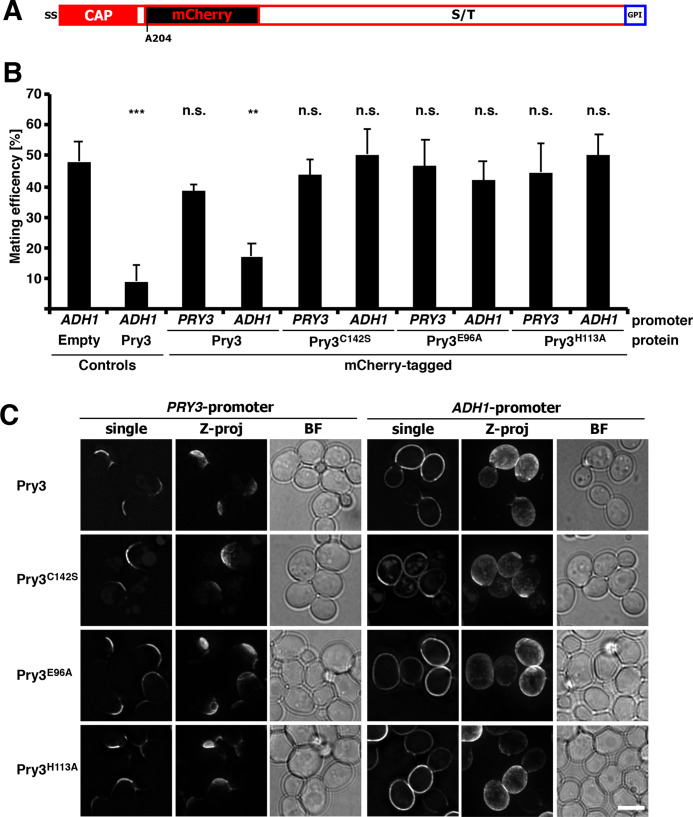
Pry3 displays polarized localization at the cell surface. (A) Structure of an internally mCherry-tagged version of Pry3. The mCherry open reading frame was inserted after the CAP domain of Pry3, after alanine 204. (B) The mCherry-tagged versions of Pry3 is functional in mating inhibition. Mating inhibition of the indicated mCherry-tagged versions of Pry3 expressed either from a strong ADH1 promoter or from the endogenous PRY3 promoter was assessed using the quantitative mating assay. Values represent means±s.d. of four independent determinations. Asterisks denote statistical significance (Welch t-test; **P-value <0.01; ***P-value <0.001; n.s., not significant). (C) Polarized surface localization of Pry3. Plasmid-borne copies of wild-type and the indicated mutant versions of mCherry-tagged Pry3 were analyzed by fluorescent microscopy in living cells. Pry3 was expressed either from its endogenous promoter or from an ADH1-promoter. When expressed from the endogenous promoter, Pry3 displays polarized cell surface localization whereas if overexpressed from the ADH1-promoter, Pry3 shows uniform cell surface localization. Shown are deconvolved images of either a single optical section through the middle of the cell (single), or a Z-projection (Z-proj). Scale bar: 5 µm; BF, bright field illumination.

