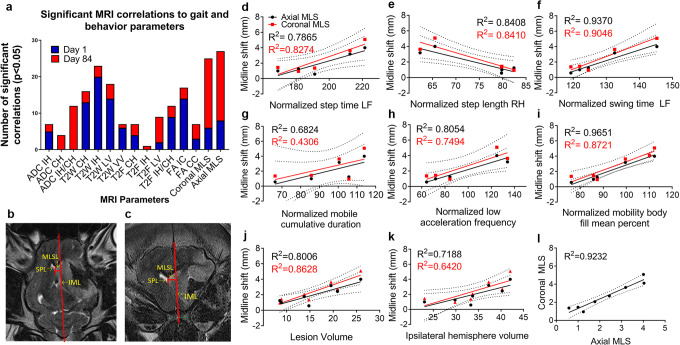
Fig. 1.
Midline shift is significantly correlated to measurements of functional outcomes. a A subset of measured gait and behavior parameters (n = 90) significantly correlated with MRI measurements at day 1 (blue) and day 84 (red) post-MCAO (Pearson’s product-moment correlations, p < 0.05). Measurements of MLS in the axial (b) and coronal (c) plane. IML: ideal midline, SPL: septum pellucidum line, MLSL: midline shift line. Linear regression of axial and coronal MLS showed significant correlations with normalized step time in the left front (d, cor: R2 = 0.8274, p = 0.0322; ax: R2 = 0.786519, p = 0.0449), normalized step length right hind (e, cor: R2 = 0.840988, p = 0.0283; ax: R2 = 0.840809, p = 0.0284), normalized swing time left front (f, cor: R2 = 0.9048, p = 0.0129; ax: R2 = 0.937, p = 0.0068), normalized mobile cumulative duration (g, cor: R2 = 0.430566, p = 0.1570; ax: R2 = 0.682416, p = 0.0427), normalized low acceleration (h, cor: R2 = 0.74939, p = 0.0259; ax: R2 = 0.805375, p = 0.0152), normalized body fill mean percent (i, cor: R2 = 0.872088, p = 0.0064; ax: R2 = 0.965138, p = 0.0005), lesion volume (j, cor: R2 = 0.862796, p = 0.0009; ax: R2 = 0.800643, p = 0.0027), ipsilateral hemisphere volume (k, cor: R2 = 0.642037, p = 0.0168; ax: R2 = 0.718771, p = 0.0078), and axial and coronal MLS (l, R2 = 0.9224, p = 0.0001)

