Fig. 3.
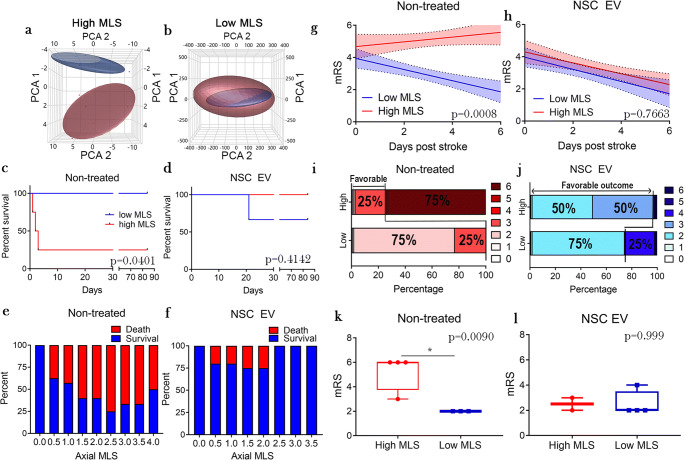
NSC EV treatment disrupts relationship of HMLS with poor survival and mRS score. PCA of all gait parameters measured from day 0 through day 14 post-MCAO in animals with HMLS (a) and LMLS (b). Non-treated animals with HMLS (a, red) are separated from NSC EVs animals HMLS (a, blue), while there is no separation of non-treated and NSC EVS animals with LMLS (b, red and blue, respectively). Differences in survival between non-treated (c, p = 0.0401) and NSC EV–treated animals (d, p = 0.4142) with either HMLS or LMLS as well as differences in survival with increasing MLS in non-treated (e) and NSC EV–treated (f). MLS versus mRS score days 0–6 post-MCAO in non-treated (g) and NSC EV–treated (h) animals. In the non-treated group, there was a significant difference in the slopes and speed of recovery of the HMLS (red) and LMLS (blue) groups (p = 0.0008), while there was no significant difference in the slopes of the NSC EV HMLS and LMLS lines (p = 0.6754). Stacked graphs showing distribution of mRS scores at day 84 post-stroke in non-treated (i) and NSC EV–treated (j) animals. While non-treated animals had a decreased chance of favorable outcome with HMLS (25%) compared with LMLS (100%), NSC EV–treated animals did not (HMLS = 100%, LMSL = 75%). Box and whisker plots of mRS score at day 6 post-MCAO in non-treated (k) and NSC EV (l) animals. Non-treated animals with HMLS had a significantly higher mRS score at day 6 post-MCAO (p = 0.0090), while NSC EV–treated animals did not (NSC EVS: p = 0.9999)

