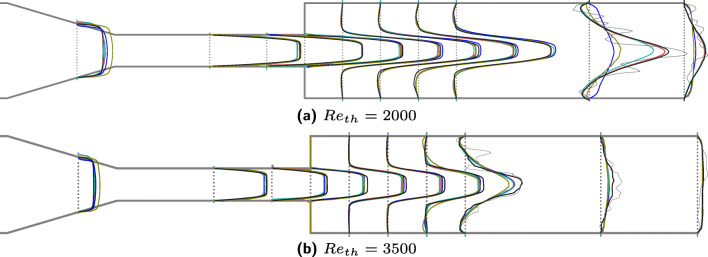
Fig. 6.
Radial velocity profiles at 10 locations (z3 − z12 shown in Fig. 1) along the length of the nozzle for two different Reynolds numbers averaged over 8 s or 400,000 time steps. The velocities are normalized to enable an intuitive comparison. The black lines show the averaged velocities computed from XR LBM simulations whereas red, blue, green, and olive-colored lines are the data from experiment ids #243, #297, #763, and #999 respectively. The gray dotted lines at locations z11 and z12 for Reth = 2000 and at z10, z11, and z12 for Reth = 3500 show instantaneous radial velocities from LBM simulations to depict the location of jet breakdown

