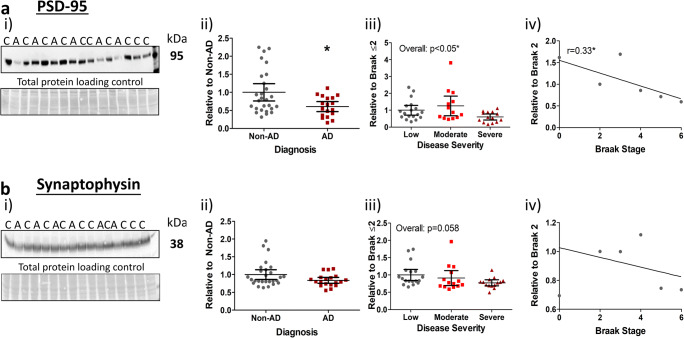
Fig. 1.
Postsynaptic markers decrease with AD progression. i) Representative images of western blots probed for a PSD-95 and b synaptophysin with molecular weights and diagnosis of non-AD (controls, (C)) and AD (A) indicated. An area of each blot stained for total protein loading is additionally shown as means of a loading control. Quantified markers were stratified according to ii) diagnosis, iii) disease severity (low, Braak 0–2; moderate, Braak 3–4; severe, Braak 5–6) and iv) individual Braak stage for Spearman’s rank correlation (r) analysis. Significant post hoc inter-group differences are indicated (*). Data for PSD-95 (n = 45) and synaptophysin (n = 46) are provided as scatter plots with means with 95% confidence intervals, *p < 0.05

