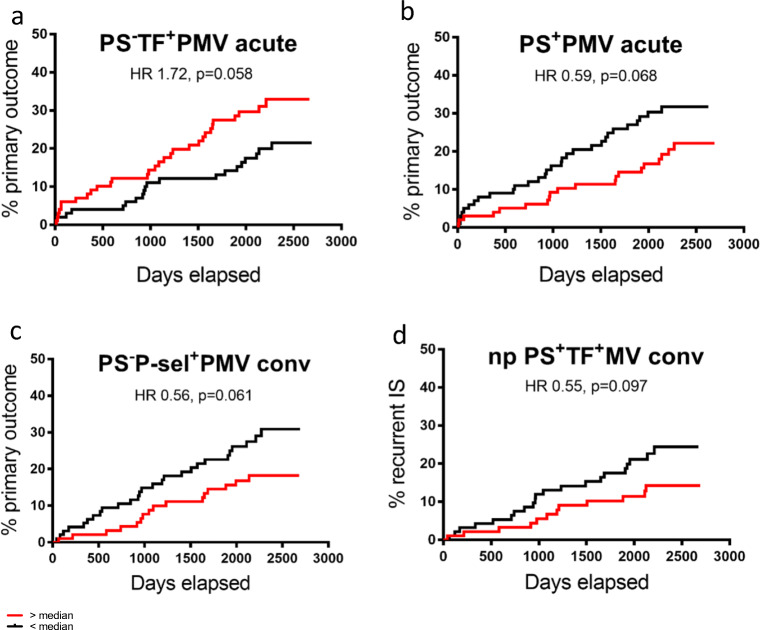
Fig. 5.
Univariate Kaplan-Meier curves for recurrent ischemic events versus respective MV concentrations above (red curves) and below median (black curves). a Primary outcome for patients with PS−TF+PMV above and below median in the acute phase. b Primary outcome for PS+PMV above and below median in the acute phase. c Primary outcome for patients with PS−P-sel+PMV above and below median in the convalescent phase. d Secondary outcome recurrent IS for patients with non-platelet PS+TF+MV above and below median in the convalescent phase

