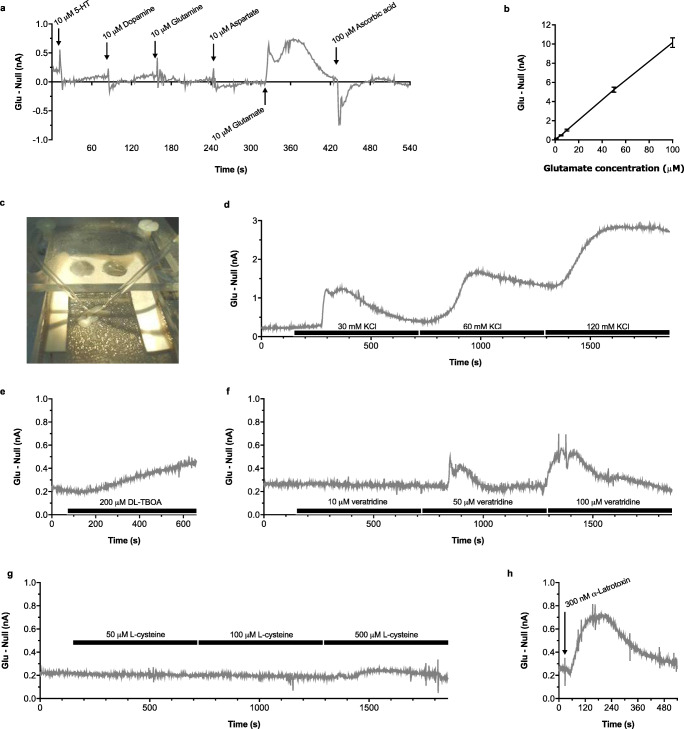
Fig. 2.
Characterization of the glutamate microsensor signal prior to studies in neurodevelopmentally manipulated rats. Representative a, d–h or mean ± SEM b difference in current output between glutamate and null sensors on addition of a exogenous glutamate or potential interfering agents, which demonstrates a selective response to glutamate, and b increasing concentrations of glutamate in the absence of tissue, which demonstrates a linear relationship, as well as following insertion of sensors into the CA1 region c of separate slices from drug-naïve group-housed rats (n = 3) where glutamate signals were increased by exposure to d elevated KCl, e the glutamate reuptake inhibitor DL-TBOA, f sodium channel activator veratridine, g antiport exchange substrate L-cysteine, or h α-latrotoxin which induces exocytosis from presynaptic vesicles, suggesting neuronal origin of the glutamate signal. Bars represent 10-min perfusion via the aCSF reservoir, and arrows local application to the interface chamber

