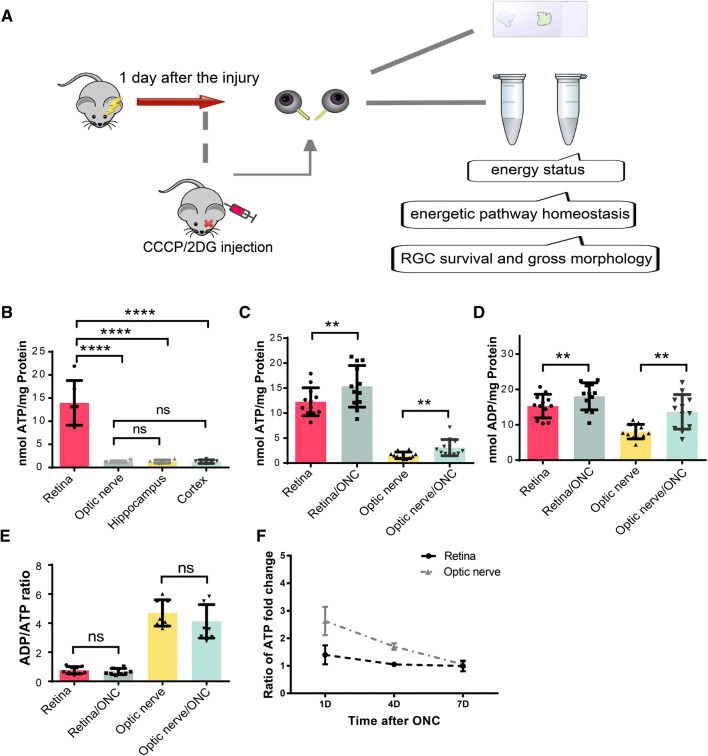
Fig. 1.
Optic nerve crush (ONC)-stimulated energy metabolism in the retina and optic nerve. A Schematic of the experimental design. The main outcome measurements included the energy status (ATP levels, ADP levels, and the ADP/ATP ratio), energetic pathway homeostasis (glycolysis and oxidative phosphorylation activity and relative proportions), and retinal ganglion cell (RGC) status (numbers of surviving cells and gross morphology). B Basal ATP levels in the retina, optic nerve, hippocampus, and cortex. C, D ATP and ADP levels in retina and optic nerve 1 day after ONC. E The dynamic balance of energy metabolism presented as the ADP/ATP ratio. F ATP concentration-time curves for retinas and optic nerves 1, 4, and 7 days after ONC. **P < 0.01, ****P < 0.0001; ns, not significant.

