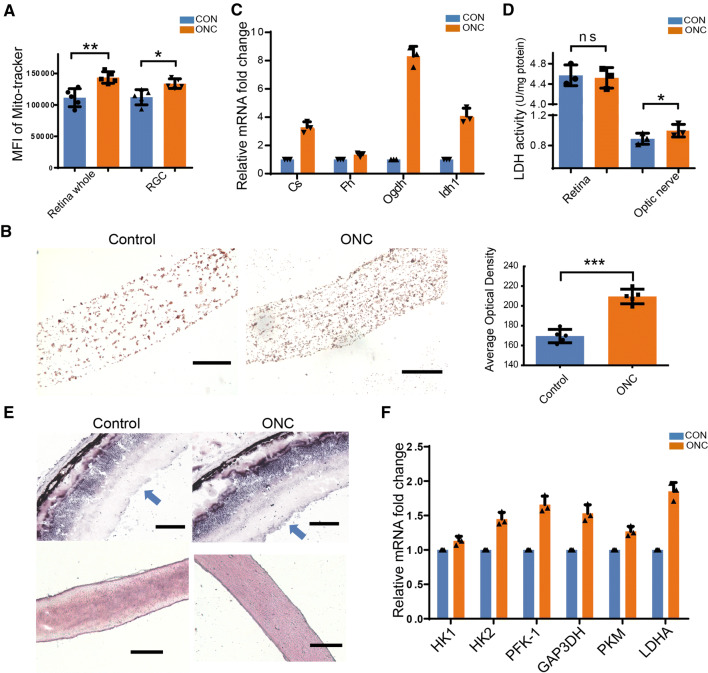
Fig. 2.
Changes in glycolysis and mitochondrial oxidative phosphorylation after ONC. A Statistical analysis of the mean fluorescence intensity of MitoTracker staining in retinal cells and RGCs. B Representative images and quantitative analysis of diaminobenzidine staining of cytochrome oxidase in injured and sham-operated optic nerves. C mRNA levels of tricarboxylic acid cycle enzymes in crushed optic nerves after ONC. D Quantitative analysis of lactate dehydrogenase (LDH) activity in the optic nerve and whole retina after ONC. E Representative images of LDH activity (blue/purple staining) in the retina (upper) and the optic nerve (lower) after injury [note intense and disseminated staining in the RGC layer (blue arrows); qualitative analysis in Table S1]. F mRNA levels of glycolytic enzymes in optic nerves after ONC. Scale bars in B and E, 100 μm.

