Fig. 1.
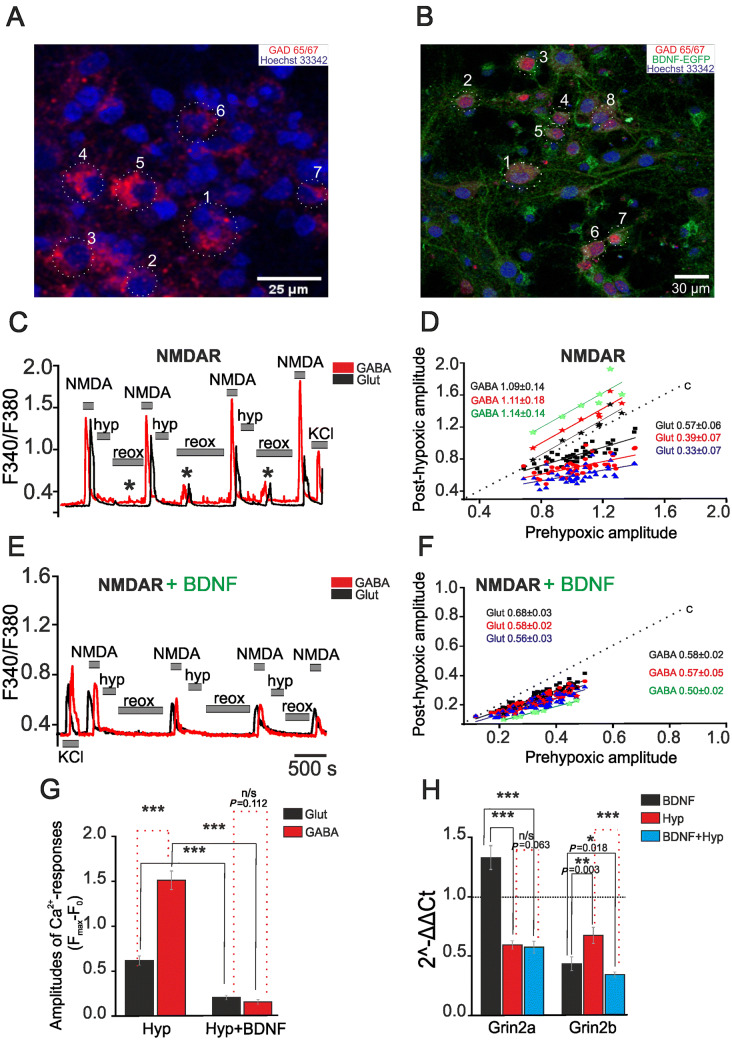
Effects of BDNF overexpression on the amplitude of NMDA-induced Ca2+ responses and expression of NMDAR subunits. A Identification of GABAergic neurons in a rat hippocampal culture (blue, nuclei stained with Hoechst 33342). Cells 1–7 are GABAergic neurons [averaged Ca2+ signal shown as the red trace in C, and individual amplitudes in D (stars)]. B Immunostaining of GABAergic neurons in a culture transduced with (AAV)-Syn-BDNF-EGFP (green). Cells 1–8 are GABAergic neurons [averaged Ca2+ signal shown as the red trace in E, and individual amplitudes in F (stars)]. C, E Averaged Ca2+ responses to NMDA (10 µmol/L in Mg2+-free medium) in GABAergic (red trace) and glutamatergic (black trace) neurons from non-transduced cultures (C) and those transduced with (AAV)-Syn-BDNF-EGFP (E) (hyp, reox: brief episodes of hypoxia and reoxygenation; *spontaneous synchronous Ca2+ pulses reflecting post-hypoxic hyperexcitation). D, F Amplitude of Ca2+ responses (arbitrary units) of individual neurons to NMDA after hypoxia/reoxygenation cycles before preconditioning for GABAergic (stars) and glutamatergic neurons from non-transduced cultures (D) and those transduced with (AAV)-Syn-BDNF-EGFP (F) [dotted lines (c): linear function of data from control cultures (without hypoxia/reoxygenation cycles); black squares, red circles, and green triangles: responses of glutamatergic neurons after the first, second, and third cycles of hypoxia/reoxygenation, respectively; black, red and green stars: responses of GABAergic neurons after the first, second, and third hypoxia/reoxygenation cycles; solid lines in corresponding colors: linear regressions approximating the amplitudes of Ca2+ responses for both populations of neurons]. G Averaged amplitudes of Ca2+ responses of glutamatergic (black) and GABAergic (red) neurons to NMDA (10 µmol/L in Mg2+-free medium) after three hypoxia/reoxygenation cycles in non-transduced (Hyp) and transduced cultures (Hyp + BDNF). H Effects of neuronal BDNF overexpression on the expression of Grin2a and Grin2b genes in transduced cultures that were not exposed to hypoxia (black) and the transduced cultures 24 h after the preconditioning with short episodes of hypoxia (blue) (red bars (Hyp), levels of Grin2a and Grin2b expression in non-transduced cultures 24 h after preconditioning with brief episodes of hypoxia). The level of expression in non-transduced cultures that were not exposed to hypoxia was set at 1 (dotted line).

