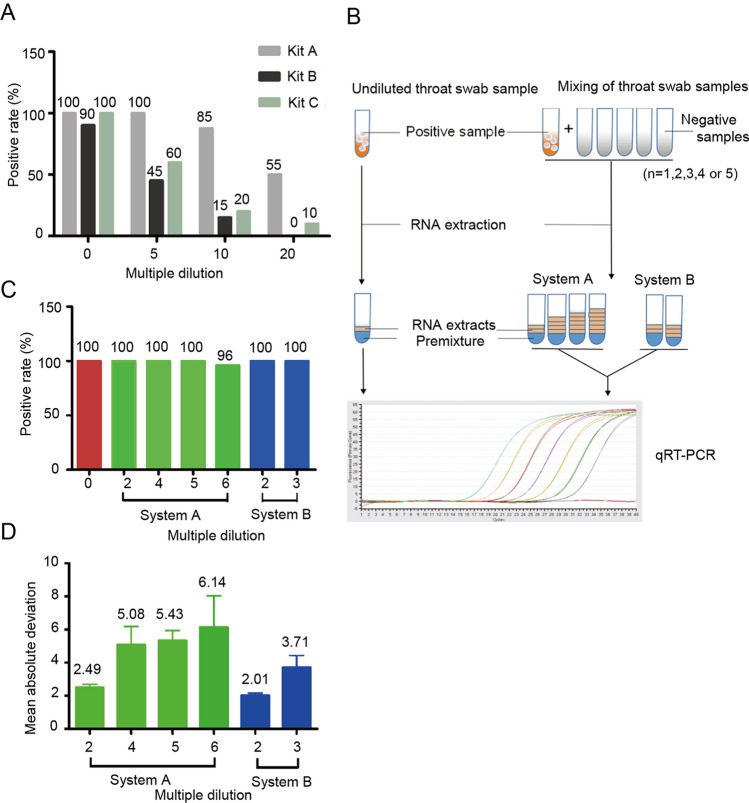
Fig. 1.
A Positive qRT-PCR detection rates for diluted throat swab samples using the three detection kits. Swab samples were diluted 5-, 10-, or 20-fold. B Schematic diagram of sample mixing and the two qRT-PCR systems. C Positive detection rate of diluted throat swab samples using two systems for qRT-PCR. D Mean absolute deviation of detected Ct values using systems A and B.

