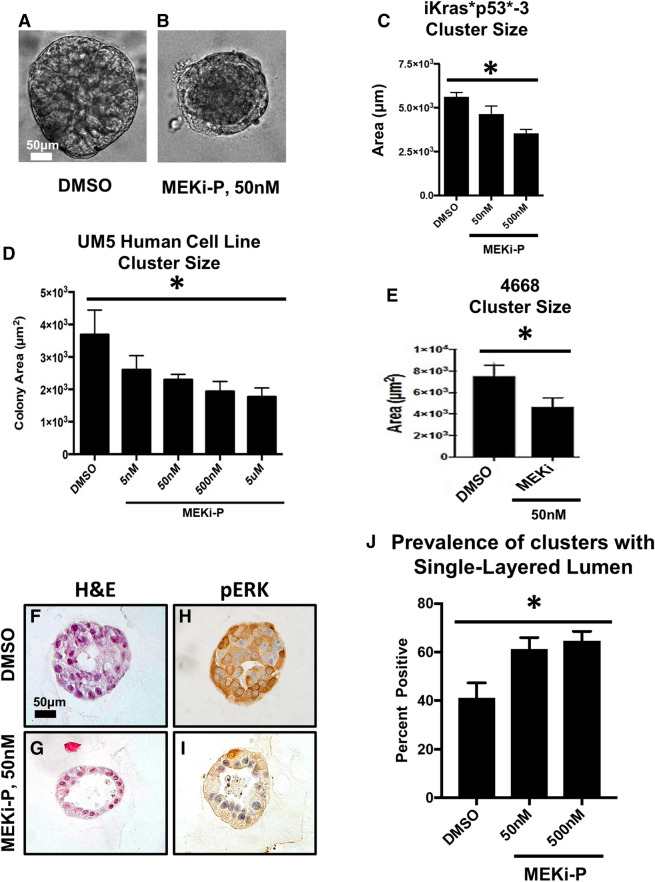
Figure 3.
Kras* effector blockade abrogates Kras*-mediated growth in 3D. (a,b) Brightfield images of iKras*p53* cells plated in 3D given either DMSO or a MEK inhibitor for seven days. Quantification of cluster area, 4 days post treatment; at least 100 clusters per treatment group were analyzed. Bars represent cluster area mean ± SEM. ANOVA statistical analysis; * indicates p < 0.01 of the cluster area. (c) Quantification of cluster cross sections with a single layer of epithelial cells adjacent to the Matrigel as well as lumen that accounts for > 75% of the cluster area. Over 50 cluster cross sections per treatment group were analyzed. Bars represent single layer cluster prevalence per technical replicate, mean ± SEM. ANOVA statistical analysis; * indicates p < 0.01. (d,e) Quantification of cluster cross sections of human UM5 cell lines and 4,668 cell lines. (f,g) Hematoxylin/eosin stains of representative cluster cross sections of of iKras*p53* cells plated in 3D given either DMSO or a MEK inhibitor for seven days. (h,i) Immunohistochemical staining of phosphorylated ERK at Thr202 and Tyr204 (pERK); brown dye indicates positive staining. Scale bars 50 µm.

