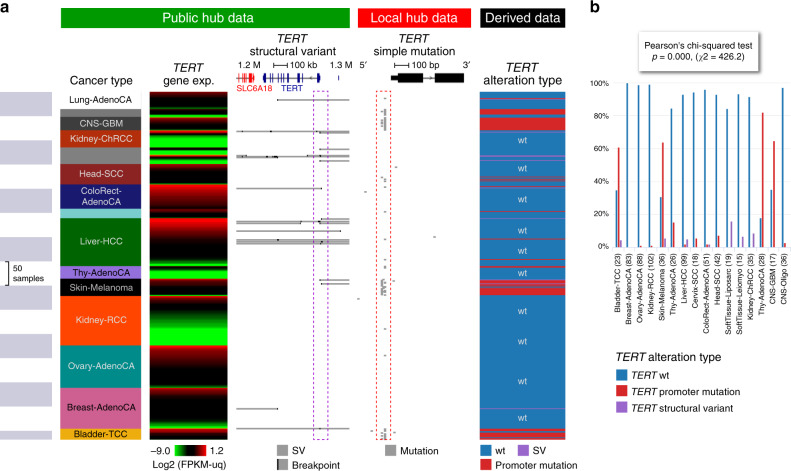
Fig. 2. UCSC Xena views of TERT across cancer types.
a Visual spreadsheet view of TERT multi-omics data across PCAWG cancer types. Data from the PCAWG public hub are under the green section, and protected data from the user’s local Xena hub are under the red section. The public and private datasets are integrated in the browser, keeping the private data protected. Many of the cancer types show TERT alterations, either as simple somatic mutations in the promoter region (as seen in the pileup highlighted in the red box) or as structural variants (as seen in the breakpoint pileup upstream of TERT highlighted in the purple box). Only cancer types that have a TERT alteration are displayed (n = 718 samples). The last column, dynamically generated in the browser, shows which samples have promoter mutations, which have structural variants, and which have none. No sample is observed to have both promoter mutations and structural variants; hence, the two types of alterations are mutually exclusive. b Distribution of different types of TERT alterations across cancer types, as shown in Xena chart view. Xena automatically runs the appropriate statistical test for every chart; in this case, Xena calculated that the difference in distributions across cancer types is statistically significant.

