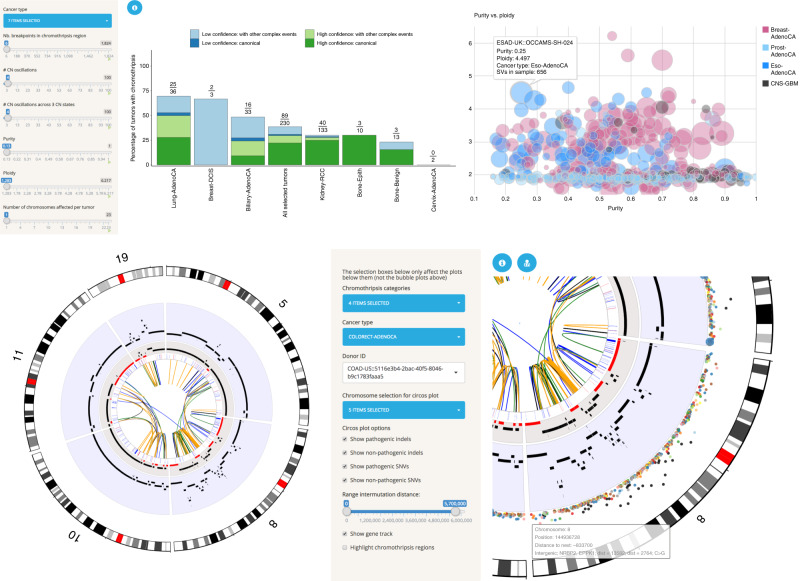
Fig. 3. Functionalities of the Chromothripsis Explorer.
a Interactive bar plot for visualization of chromothripsis rates for selected cancer types. The left-hand side panel shows variables used for detection of chromothripsis patterns (e.g., number of copy number oscillations; Cortés-Ciriano10). The user can modify the values of those variables to explore chromothripsis rates as a function of stringency criteria. The right-hand panel shows additional functionalities for exploring the relationship between purity and ploidy for tumors of selected cancer types. b Visualization of complex rearrangements involving five chromosomes in a ColoRect-AdenoCA donor (ICGC ID: DO9034). The right-hand panel shows a zoomed view of chromosome 8 that illustrates the tracks available in the Circos plots. From the outer to the inner ring, the tracks correspond to hg19 cytobands, SNVs (colored according to the mutation type and distributed according to the inter-mutation distance), total copy number (over a blue background), minor copy number (LOH regions, with a minor copy number equal to 0 depicted in red), gene track, and SVs. Further information about the tracks can be accessed by clicking on the blue information circle located above the Circos plot.

