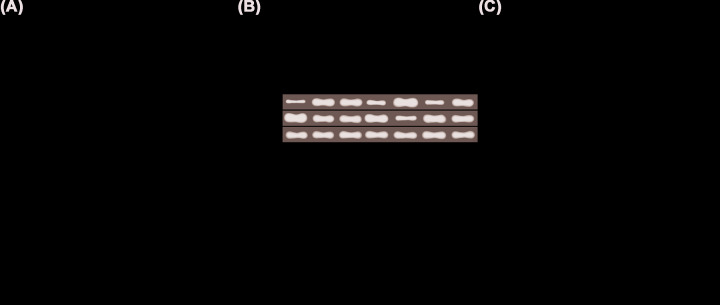
Figure 4. Bax and Bcl-2 mRNA and protein expressions in the lung tissue.
(A) Bax and Bcl-2 mRNA expressions, (B) Bax and Bcl-2 protein bands, (C) Bax and Bcl-2 protein expressions. Compared with normal group, *P<0.05; compared with model group, #P<0.05; compared with NC group, %P<0.05; compared with miR-143-3p mimic group, &P<0.05; compared with miR-143-3p inhibitor group, $P<0.05; compared with TAK-242 group, @P<0.05.

