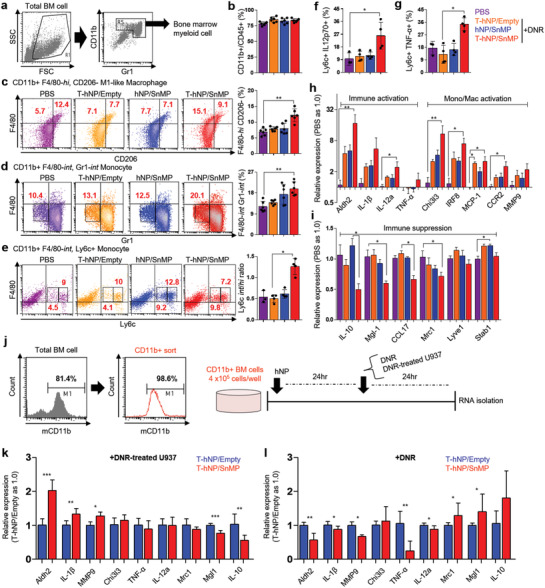
Figure 7.

Immune reprogramming and activation effect of HO1‐inhibiting T‐hNP in bone marrow myeloid cells. a) Gating strategy for bone marrow myeloid cells. The CD11b+ and Gr1+ cells were gated for further analysis. b) The ratio of CD11b+ myeloid cells to CD45+ total immune cells. c) The ratio of F4/80‐hi, CD206‐ M1‐like macrophages in total myeloid cells. d) The ratio of Gr1‐int and F4/80‐int monocytic cells in total myeloid cells. e) The ratio of Ly6c‐int and Ly6c‐hi monocyte in total bone marrow myeloid cells. f) Flow cytometric analysis of intracellular IL‐12p70 expression in bone marrow CD11b+ Ly6c+ monocytes. g) Flow cytometric analysis of intracellular TNF‐α expression in bone marrow CD11b+ Ly6c+ monocytes. Data are presented as mean ± SD, *p < 0.05, **p < 0.01 by a non‐parametric Kruskal–Wallis‐test, n.s = not significant (n = 6 per group for b, c, d, n = 3–4 per group for e, f, and g). h) Immune activation and monocyte/macrophage activation marker gene expression levels in bone marrow. i) Immune suppression and M2‐like macrophage marker gene expression levels in bone marrow. Data are presented as mean ± SEM, *p < 0.05, **p < 0.01 by non‐parametric Kruskal–Wallis‐test, n.s = not significant, n = 5 per group for h and i. j) Magnetic cell sorting for CD11b+ myeloid cells and experimental scheme for ex vivo analysis. Bone marrow cells were harvested from C57BL/6 mice and analyzed by flow cytometry before and after sorting. k) Marker gene expression levels in HO1‐inhibited CD11b+ myeloid cells in response to apoptotic leukemia. l) Marker gene expression levels in HO1‐inhibited CD11b+ myeloid cells in response to chemotherapy. Data are presented as mean ± SD, *p < 0.05, **p < 0.01, ***p < 0.001 by Student's t‐test, n.s = not significant, n = 3–4 per group for (k,l).
