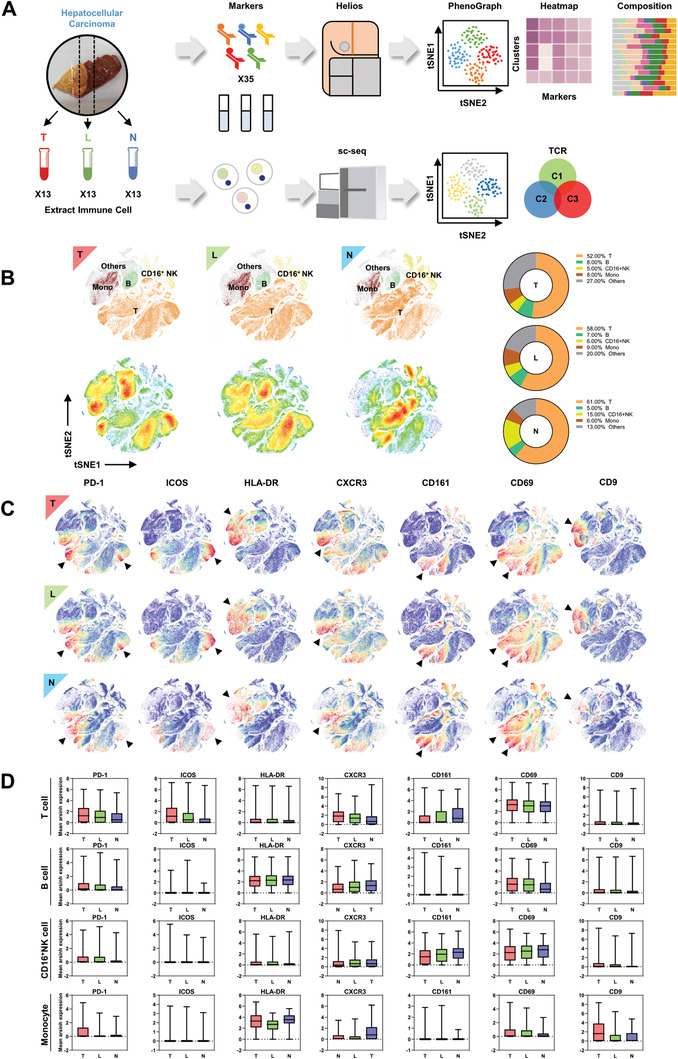
Figure 1.

The spatial heterogeneities of major immune cell lineages in hepatocellular carcinoma. A) Graphical abstract of the whole workflow. Surgical resected samples were extracted for immune cells and processed with metal‐labeled antibodies and put into time‐of‐flight mass cytometry pipeline. Acquired data were visualized after dimension reduction. Cell clusters were identified by manual gating strategy and clustering algorithm. T refers to tumor core region; L refers to leading‐edge area; N refers to nontumor region. B) tSNE plots of CyTOF data from tumor infiltrating leukocyte (TIL), leading‐edge region infiltrating leukocyte (LIL), and nontumor region infiltrating leukocyte (NIL). Immune lineages were identified and percentage of which were compared (right). C) tSNE plots of CyTOF data from TIL, LIL, NIL as gated on: PD‐1, ICOS, HLA‐DR, CXCR3, CD161, CD69, CD9. Each dot represents one single cell. Arrows showed distinct expression among three regions. D) The expression of surface molecules showed regional difference in immune lineages.
