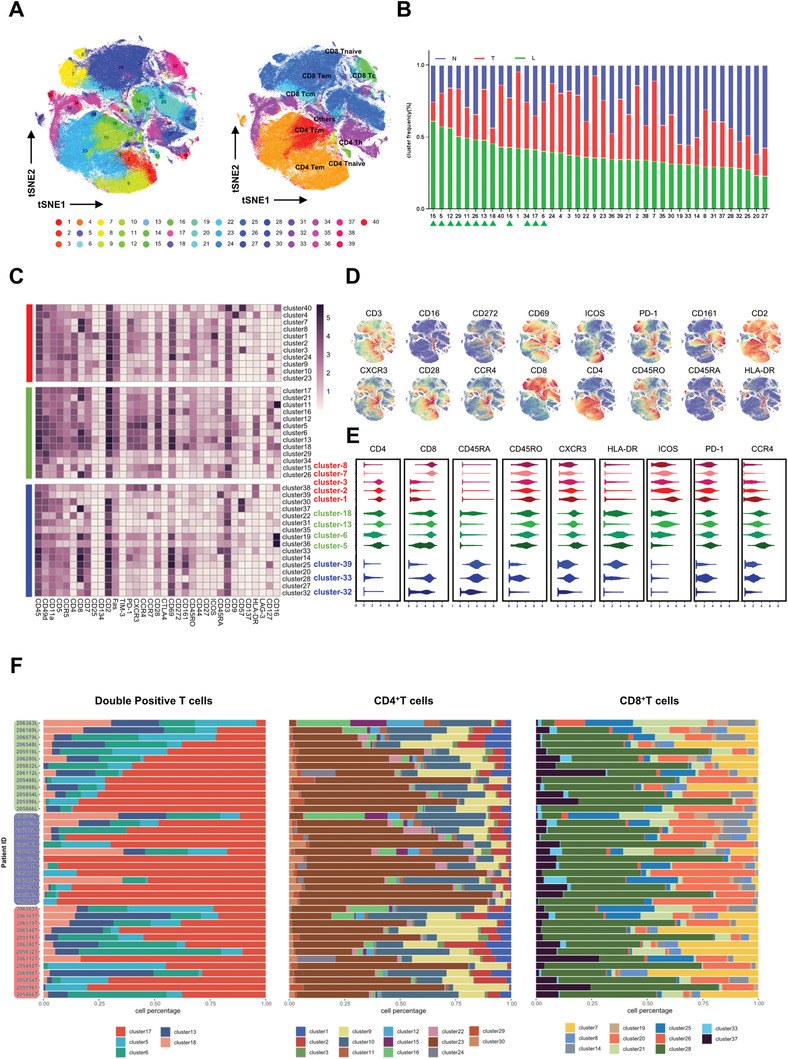
Figure 2.

The constitution of T cell clusters showed regional diversity and L region displayed unique immune contexture in terms of T cell. A) tSNE plots showed that 40 clusters were identified in total T cells via FlowSOM clustering method (left). Identified classic T cell subsets were shown on the right. B) Cluster frequency of each of the 40 cluster in T/L/N was shown. The order of the clusters was based on their frequency in L. C) Heatmap showed the mean expression level of all 35 makers in all 40 T clusters. T/L/N enriched clusters were marked on the left. D) tSNE plots of normalized marker expression of T cells from all samples. E) The expression level of several T cell clustering markers and functional markers in T/L/N‐enriched clusters. F) Frequencies of CD8+, CD4+, and DPT clusters for each HCC sample.
