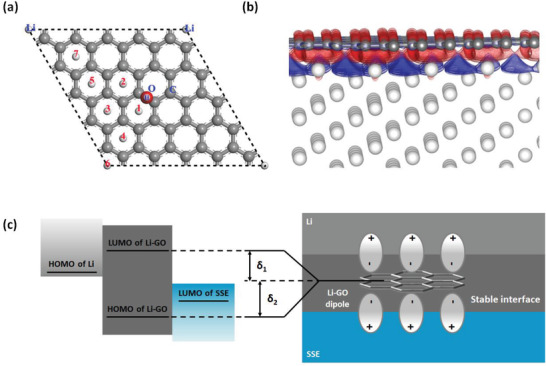
Figure 2.

a) Representation of the supercell used for the calculation of Li adsorption on the GO layer. An epoxy group is placed at the center of the supercell. The numbers depict the sites of Li adsorption. b) Calculated charge density ρ diff contours between the Li/G interface. The isosurface values of red and blue contours are 0.013 (gain charge) and −0.013 e Å−3 (loss charge), respectively. Gray and white spheres represent C and Li atoms, respectively. c) Schematic representation of the possible increase of HOMO/LUMO energy gap of the Li‐GO structure due to the appearance of an interface dipole.
