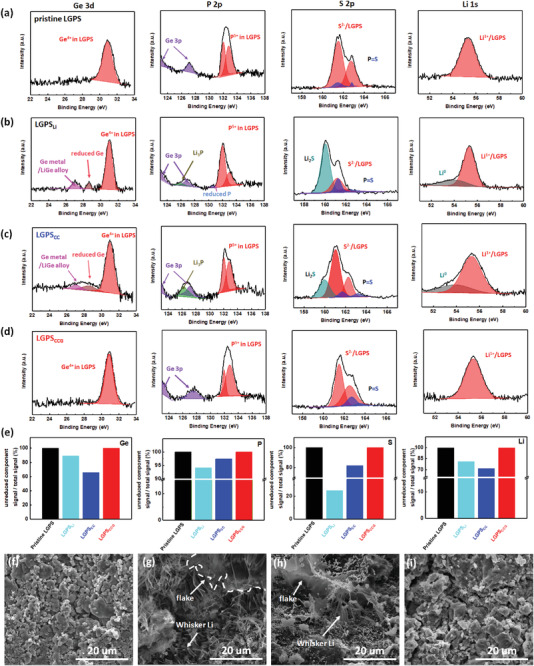
Figure 5.

a–d) Ge 3d, P 2p, S 2p, and Li 1s XPS spectra of a) pristine LGPS, b) LGPSLi, c) LGPSCC, and d) LGPSCCG. e) Ratio of the unreduced component peak areas onto the total peak areas of the investigated samples for Ge, P, S, and Li XPS spectra. f–i) SEM images of f) pristine LGPS, g) LGPSLi, h) LGSPCC, and i) LGPSCCG.
