Figure 6.

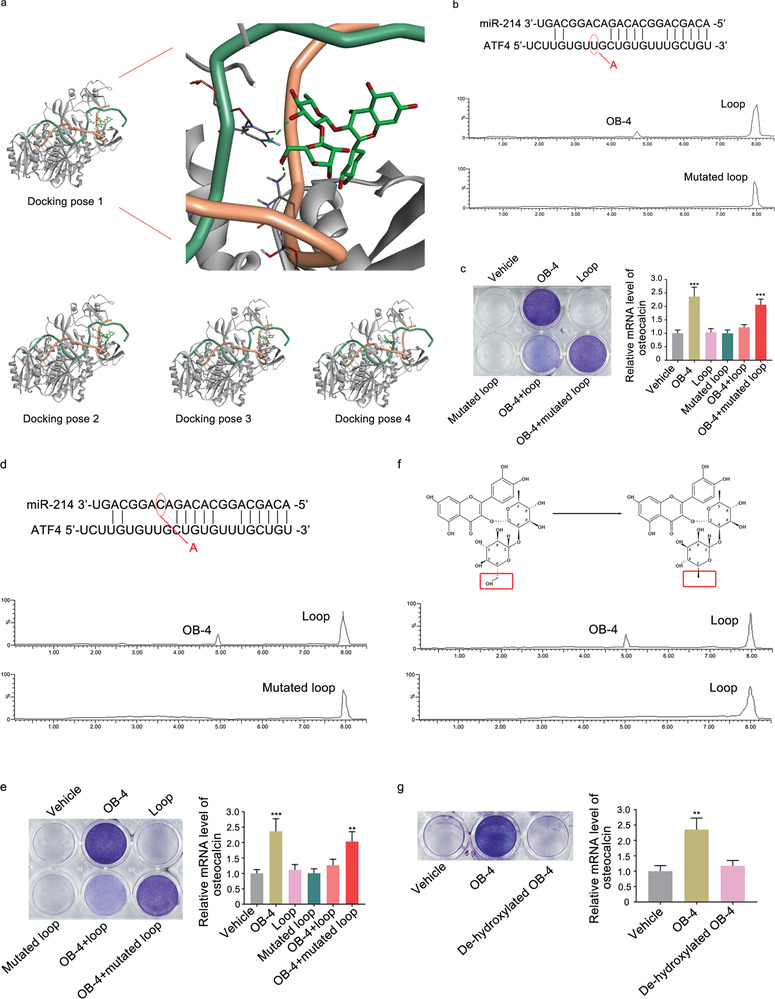
The mode of action for the optimal small molecule OB‐4. a) Left: Docking pose 1 shows OB‐4 (oxygen atoms in red, hydrogen atoms in white, carbon atoms in green) bound to the loop formed by miR‐214 (backbone: green ribbons) and ATF4 mRNA (backbone: orange ribbons) in the complex of AGO protein (grey ribbons). Docking pose 1 has the highest score among the four obtained docking poses. Right: A partial magnification of the docking pose 1 illustrates the binding sites between the small molecule OB‐4 and loop formed by miR‐214 and ATF4. Potential hydrogen‐bonding interactions between the small molecule OB‐4 and C15 and U9 of the miR‐214 and ATF4 loop are highlighted (green dashed lines). The other three computational docking poses show OB‐4 bound to the loop formed by miR‐214 and ATF4 mRNA in the complex of AGO protein. b) Pull‐down assay using streptavidin magnetic bead to examine the interaction between biotin‐labeled loop (formed by miR‐214 and mutated ATF4 mRNA) and the small molecule OB‐4. Small molecule OB‐4 captured by the mutated loop was examined by LC‐MS. c) ALP staining (left) and real‐time PCR analysis of osteocalcin mRNA level (right) in MC3T3‐E1 cells after treatment with vehicle, small molecule OB‐4, Loop, C15 mutated Loop, OB‐4 + Loop, and OB‐4 + C15 mutated loop, respectively. d) Pull‐down assay using streptavidin magnetic bead to examine the interaction between biotin‐labeled loop (formed by mutated miR‐214 and ATF4 mRNA) and the small molecule OB‐4. Small molecule OB‐4 captured by the mutated loop was examined by LC‐MS. e) ALP staining (left) and real‐time PCR analysis of osteocalcin mRNA level in MC3T3‐E1 cells after treatment with vehicle, small molecule OB‐4, Loop, U9 mutated Loop, OB‐4 + Loop, and OB‐4 + U9 mutated loop, respectively. f) Pull‐down assay using streptavidin to examine the interaction between biotin‐miR‐214‐ATF4 loop and the de‐hydroxylated small molecule OB‐4. De‐hydroxylated small molecule OB‐4 captured by the loop was examined by LC‐MS. g) ALP staining (left) and real‐time PCR analysis of osteocalcin mRNA level in MC3T3‐E1 cells after treatment with vehicle, small molecule OB‐4, and de‐hydroxylated OB‐4, respectively. *p < 0.05, **p < 0.01, ***p < 0.001 versus vehicle group.
