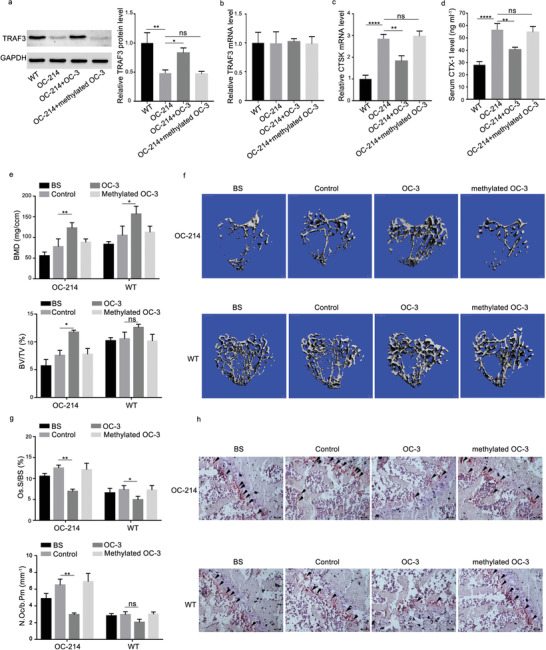
Figure 10.

The effects of the small molecule OC‐3 on osteoclastic bone resorption in osteoclast‐specific miR‐214 knock‐in mice. a) Bone tissues levels of TRAF3 protein were determined by western blot analysis in both wild type mice (WT) and OC‐214 mice after administration of the (D‐Asp8)‐liposome (OC‐214), (D‐Asp8)‐liposome plus OC‐3 (OC‐214+OC‐3), and (D‐Asp8)‐liposome plus methylated OC‐3 (OC‐214+methylated OC‐3), respectively. b) Bone tissues levels of TRAF3 mRNA were determined by qRT‐PCR in both WT mice and OC‐214 mice after administration of the (D‐Asp8)‐liposome (OC‐214), (D‐Asp8)‐liposome plus OC‐3 (OC‐214+OC‐3), and (D‐Asp8)‐liposome plus methylated OC‐3 (OC‐214+methylated OC‐3), respectively. c) Bone tissues levels of CTSK mRNA were determined by qRT‐PCR in both WT mice and OC‐214 mice after administration of the (D‐Asp8)‐liposome (OC‐214), (D‐Asp8)‐liposome plus OC‐3 (OC‐214+OC‐3), and (D‐Asp8)‐liposome plus methylated OC‐3 (OC‐214+methylated OC‐3), respectively. d) Serum levels of CTX‐1 were determined by ELISA in both WT mice and OC‐214 mice after administration of the (D‐Asp8)‐liposome (OC‐214), (D‐Asp8)‐liposome plus OC‐3 (OC‐214+OC‐3), and (D‐Asp8)‐liposome plus methylated OC‐3 (OC‐214+methylated OC‐3), respectively. e) microCT measurements for BMD and BV/TV in proximal tibia in both WT and OC‐214 mice after administration of the (D‐Asp8)‐liposome (OC‐214), (D‐Asp8)‐liposome plus OC‐3 (OC‐214+OC‐3), and (D‐Asp8)‐liposome plus methylated OC‐3 (OC‐214+methylated OC‐3), respectively. f) Representative images showing the 3D trabecular architecture by micro‐CT reconstruction in proximal tibia in both WT and OC‐214 mice after administration of the (D‐Asp8)‐liposome (OC‐214), (D‐Asp8)‐liposome plus OC‐3 (OC‐214+OC‐3), and (D‐Asp8)‐liposome plus methylated OC‐3 (OC‐214+methylated OC‐3), respectively. Scale bars, 500 µm. g) Bone histomorphometric measurements (Oc.S/BS and N.Oc/B.Pm) in proximal tibia in both WT and OC‐214 mice after administration of the (D‐Asp8)‐liposome (OC‐214), (D‐Asp8)‐liposome plus OC‐3 (OC‐214+OC‐3), and (D‐Asp8)‐liposome plus methylated OC‐3 (OC‐214+methylated OC‐3), respectively. h) The representative TRAP staining images for the trabecular bone in proximal tibia in both WT and OC‐214 mice after administration of the (D‐Asp8)‐liposome (OC‐214), (D‐Asp8)‐liposome plus OC‐3 (OC‐214+OC‐3), and (D‐Asp8)‐liposome plus methylated OC‐3 (OC‐214+methylated OC‐3), respectively. Scale bar: 100 µm. Arrow indicates TRAP+ cells. Note: n = 6 for each group. Data were means ± SD. *p < 0.05, **p < 0.01, ***p < 0.001, ****p < 0.0001, ns denotes non‐significance. BS: mice that were sacrificed before treatment as baseline; control: mice treated with (D‐Asp8)‐liposome as negative control.
