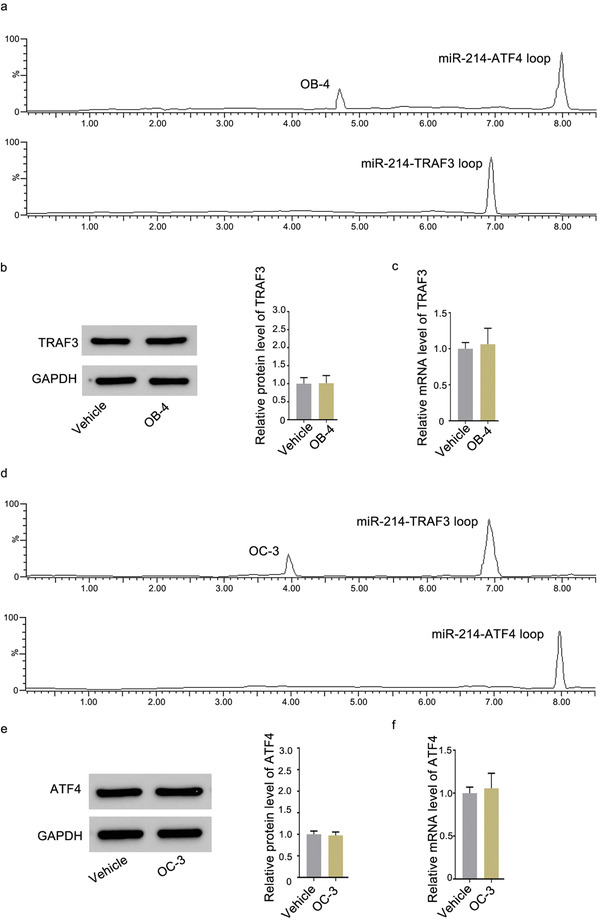
Figure 11.

Determination of the specificity of OB‐4 and OC‐3. a) Pull‐down assay was performed using streptavidin magnetic bead to examine the interaction between biotin‐miR‐214‐TRAF3 loop and small molecule OB‐4. Small molecule OB‐4 captured by biotin‐miR‐214‐TRAF3 loop was examined by LC‐MS. b) Representative western blot (left) and quantification (right) of TRAF3 protein level in MC3T3‐E1 cells after treatment with the small molecule OB‐4 at 80 nm or vehicle for 48 h. c) Real‐time PCR analysis of TRAF3 mRNA level in MC3T3‐E1 cells after treatment with the small molecule OB‐4 at 80 nm or vehicle for 48 h. d) Pull‐down assay was performed using streptavidin magnetic bead to examine the interaction between biotin‐miR‐214‐ATF4 loop and small molecule OC‐3. Small molecule OC‐3 captured by biotin‐miR‐214‐ATF4 loop was examined by LC‐MS. e) Representative western blot (left) and quantification (right) of ATF4 protein level in RAW 264.7 cells after treatment with the small molecule OC‐3 at 6 µm or vehicle for 48 h. f) Real‐time PCR analysis of ATF4 mRNA level in RAW 264.7 cells after treatment with small molecule OC‐3 at 6 µm or vehicle for 48 h, respectively.
