
Figure 3.
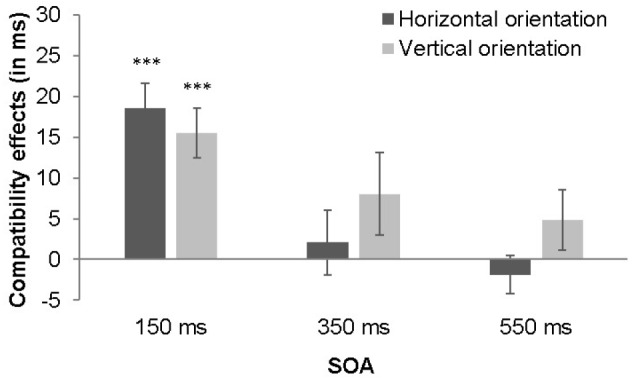
Mean RT compatibility effects (mean RT incompatible–mean RT compatible) from the 150, 350, and 550 ms SOA condition in Experiment 2 (with a German sample), separately depicted for the horizontal and vertical orientation; error bars represent the standard error of the mean (±SE); *** p < .001