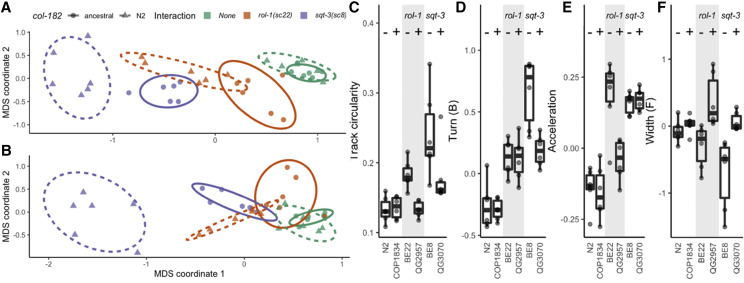
Figure 3.
Ancestral col-182 suppresses rol-1 and sqt-3 alleles. A-B. Multidimensional scaling of locomotion and size traits selected by sparse discriminant analysis that maximize suppression of rol-1 (A) or sqt-3 (B) by ancestral col-182. Point shapes show col-182 genotype (ancestral or N2), bounded by ellipses giving the 95% confidence interval under a multivariate t-distribution (solid lines for ancestral col-182), colors show genetic interaction (none in the N2 background, or alleles of rol-1 and sqt-3). Each point is the grand mean of tracks from around 500 young adult worms per replicate plate measured over three consecutive generations for each genotype, assayed for N2 (green triangles) and COP1834 (ancestral col-182 in the N2 background; green circles), BE22 (N2 col-182; rol-1(sc22); orange triangles) and QG2957 (ancestral col-182; rol-1(sc22); orange circles), and BE8 (N2 col-182; sqt-3(sc8); purple triangles) and QG3070 (ancestral col-182; sqt-3(sc8); purple circles). C-F. Univariate comparisons show variable effects across backgrounds. col-182 genotype is indicated with – (N2 allele) and + (ancestral) symbols. Complete suppression of track circularity is seen for rol-1(sc22) (C), and of worm width in the forward state for sqt-3(sc8) (F), however partial (or no) suppression is the most common outcome. Raw and processed data in Files S12 and S13, and code in File S14.

