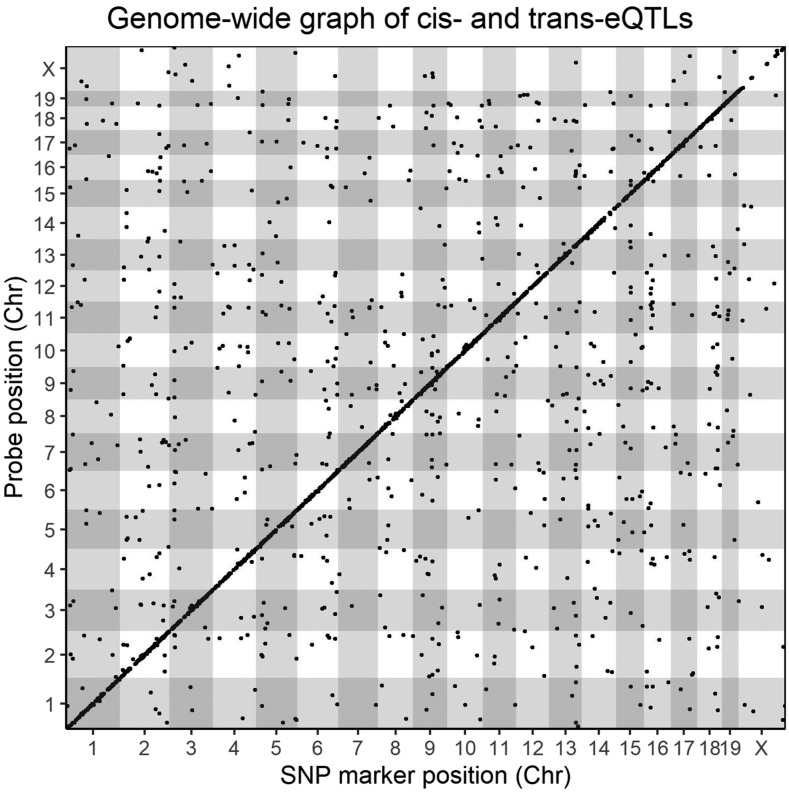
Figure 4.
Locations of kidney eQTLs in the mouse genome. The positions of the significant eQTLs (P < 0.05) are plotted against the locations of the corresponding transcript (y-axis) along with the genome (x-axis). The significance thresholds for each individual probeset were determined by performing 1000 permutations of genome-wide scans by shuffling genotype data in relation to individual gene expression data for every single probeset on the microarray. Cis-eQTLs, occurring within a 4-Mb (±2Mb) genomic window, are located at the diagonal, all other dots represent trans-regulated genes.

