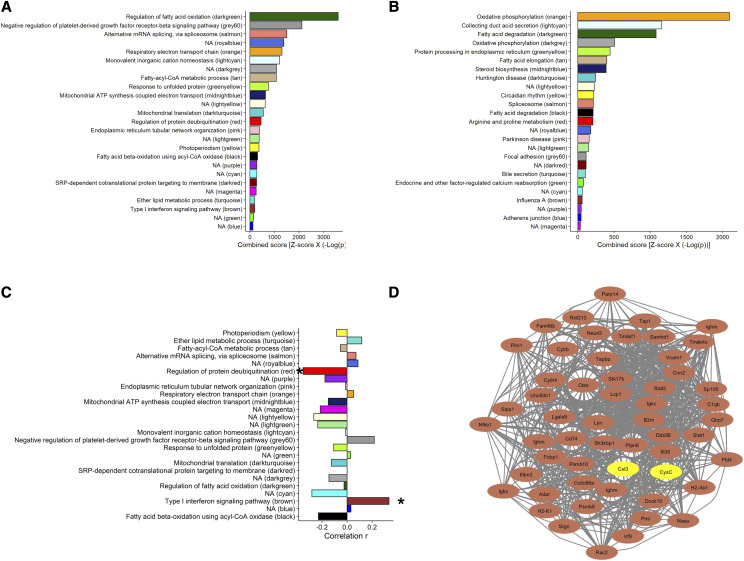
Figure 6.
Co-expression network analysis of kidney gene. (A) Top GO and (B) top KEGG pathway for each of the gene-module. (C) Correlation coeffiencent of module eigengenes with plasma CysC. “*” < 0.05. (D) Cytoscape network visualization of to 50 hubgene in the brown module and their relationship with Cst3 mRNA level is kidney and plasma CysC concentration. The brown nodes denote hubgenes in the module and the yellow nodes denote Cst3 gene and CysC protein concentration in plasma.

