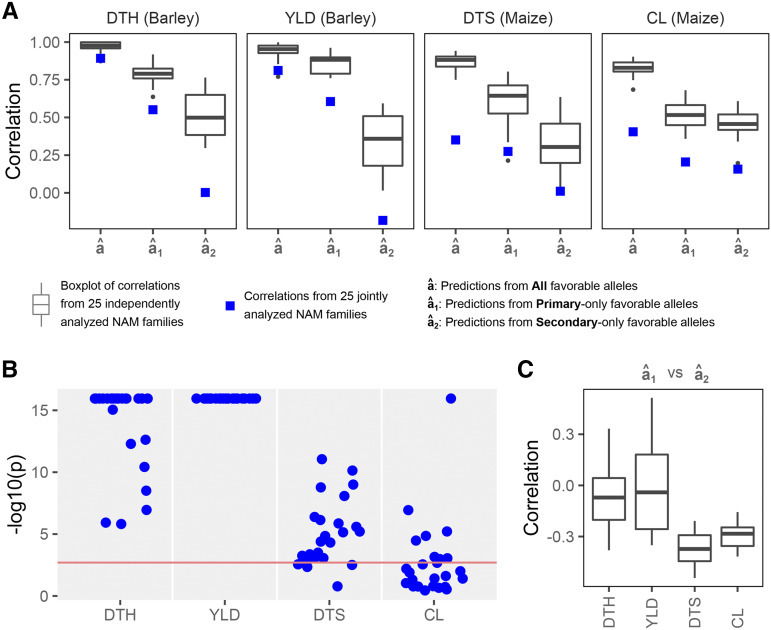
Figure 3.
Prediction accuracies and marker effect distributions across all 25 NAM families. [A] Prediction accuracies of , and are shown as the correlations between the predicted and observed trait values from the joint and independent analyses of 25 NAM families. [B] P and S distributions estimated from the independent analyses were tested using Kolmogorov-Smirnov test and the results are shown as -log10(p). The Bonferroni adjusted threshold of P = 0.05/25 is shown as a red horizontal line. [C] Correlations between and represent the potential constraints when selecting for both P and S markers in OSGS, although the lack of strong negative correlations suggests these are small.

