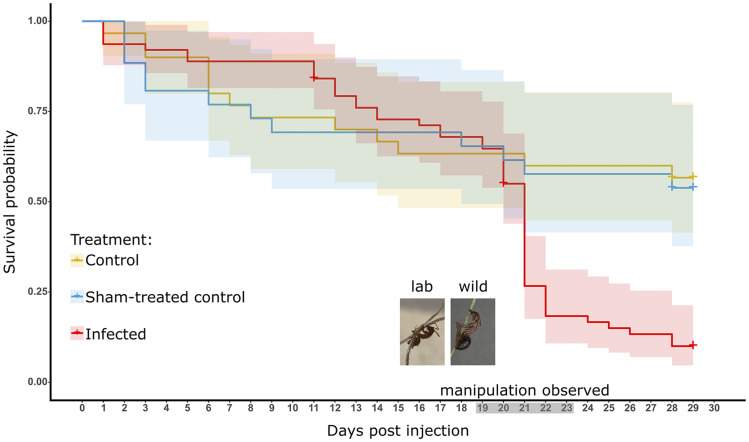
Figure 2.
Survival curves of infection experiment ants. We introduced three treatment groups in the infection experiments, ants not injected (yellow, control n = 30), injected with media-only (blue, sham-treated control n = 26), or injected with the O. camponoti-floridani (red, infected n = 63). Shaded regions around survival data indicate 95% confidence intervals. Treatment had a significant effect on survival (P = 0.00059, log-rank test). Manipulations were observed only in infected ants, 19 to 23 dpi (gray axis shading). Crosses indicate censorship events when ants were removed from the experiment and no longer contributed to analysis. The photo inserts show a live lab infected ant (left) and a wild manipulated cadaver (right).

