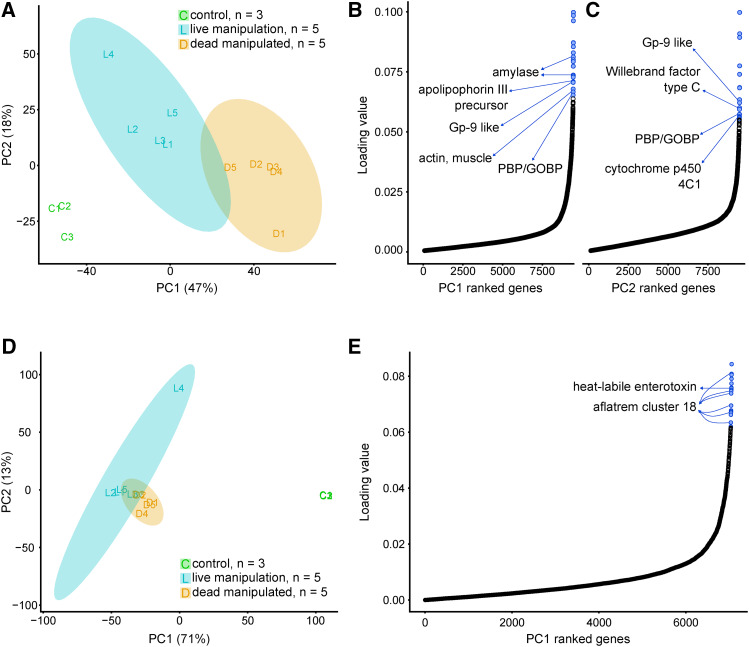
Figure 3.
Principal component analyses and principal component loading value plots of RNAseq data. Analyses are based on normalized ant (A, B, C) and fungal (D, E) gene expression values. PCA plots (A, D) show the relationship between samples that serve as controls (green) and those that were collected during live manipulation (blue) and after host death (orange). Shaded regions indicate 95% confidence ellipses. (A.) Replicates of host gene expression vary across PC1 as the state of the host progresses from healthy control ants to live manipulated hosts to dead manipulated hosts killed by the fungus. PC2 primarily describes the variation between healthy controls and live manipulated ants, but all biological groups vary along this axis. (B, C.) All ant genes ranked by loading values in PC1 (B) or PC2 (C). Most genes have low loading values, however a relatively high-loading value subset contribute the most to PC1 or PC2. Of these high value genes, the top 20 include genes that may play key roles during infection and manipulation (blue). (D.) Gene expression of the fungal parasite interacting with the ant host is clearly distinguished from that of fungal culture control samples by PC1. (E.) All fungal genes ranked by loading values in PC1. The top 20 fungal PC1 genes are highlighted and include toxin related genes (blue).

