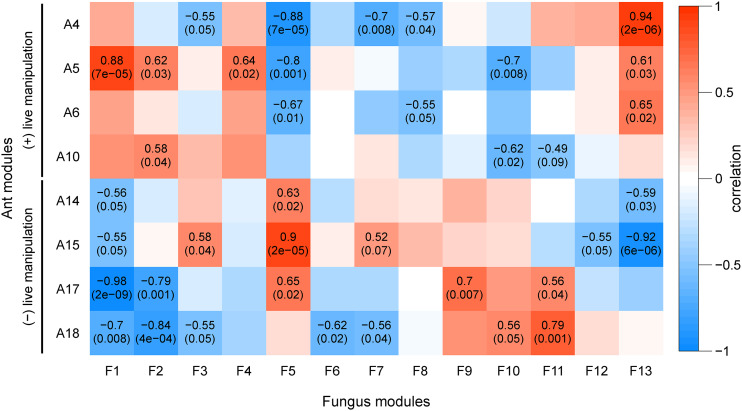
Figure 5.
WGCNA of fungal and ant modules correlated to each other. Fungal gene expression (columns) show correlation (color and top number in each cell) and p-value (in parentheses) of gene modules to selected ant modules that are either positively or negatively correlated to samples during live manipulation (rows). Pearson correlation and p-values (Fisher’s asymptotic test) are shown only for significant module to module correlations. Modules F1, F2, and F13 are enriched for secretion signals or transmembrane domains and therefore may contain extracellular fungal effectors. Modules A14 and A15 have PFAM domain overrepresentations suggesting a role in neuronal function and development.

