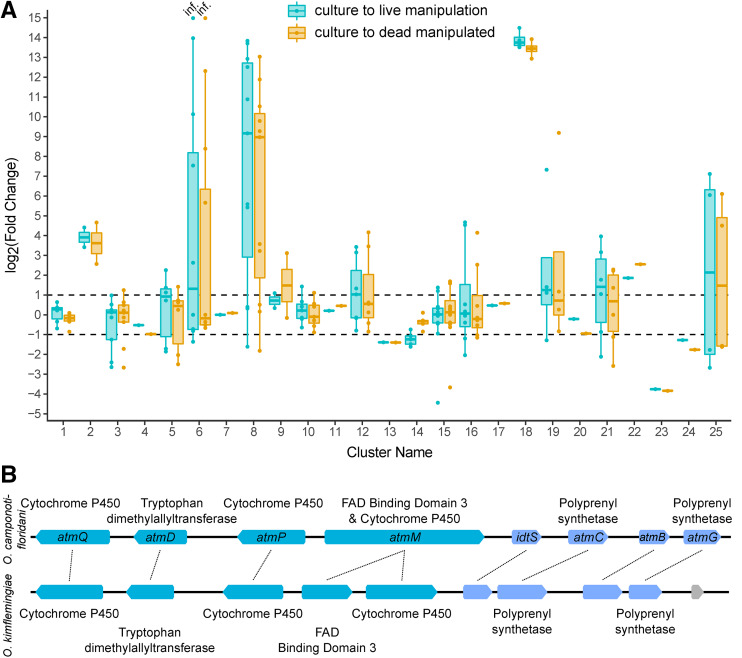
Figure 8.
Changes in expression of secondary metabolite cluster genes relative to control conditions. (A.) Fold change of secondary metabolite cluster genes transcripts during live-manipulation (blue) and in dead-manipulated samples (orange) relative to control culture. Dots represent fold change of a single gene within a metabolite cluster. Dashed lines indicate a twofold change in transcript abundance (i.e., log2(Fold Change) = ±1). Clusters 2, 6, 8, 12, and 18 are possibly involved in pathways producing entomopathogenic compounds similar to aflatoxin, fusarin C, aflatoxin, citrinin (File S3), and aflatrem, respectively. Many genes of these clusters also displayed notable increases in transcript levels relative to culture. Points labeled “inf.” in cluster 6 have infinite fold increases due to culture RPKM values equal to 0. (B.) Schematic of cluster 18 genes (top) and corresponding homologs in O. kimflemingiae (bottom). PFAM annotations are labeled outside the depicted loci and, for O. camponoti-floridani, BLASTp hits for aflatrem synthesis proteins are indicated inside. Teal indicates cluster genes identified bioinformatically, blue genes are selected cluster-adjacent genes based on their similar expression, putative function, and proximity to the main cluster (not represented in [A.]). The locus in gray is unrelated to the cluster. Image modified from output generated by Geneious Prime (v 2019.0.3, Biomatters).

