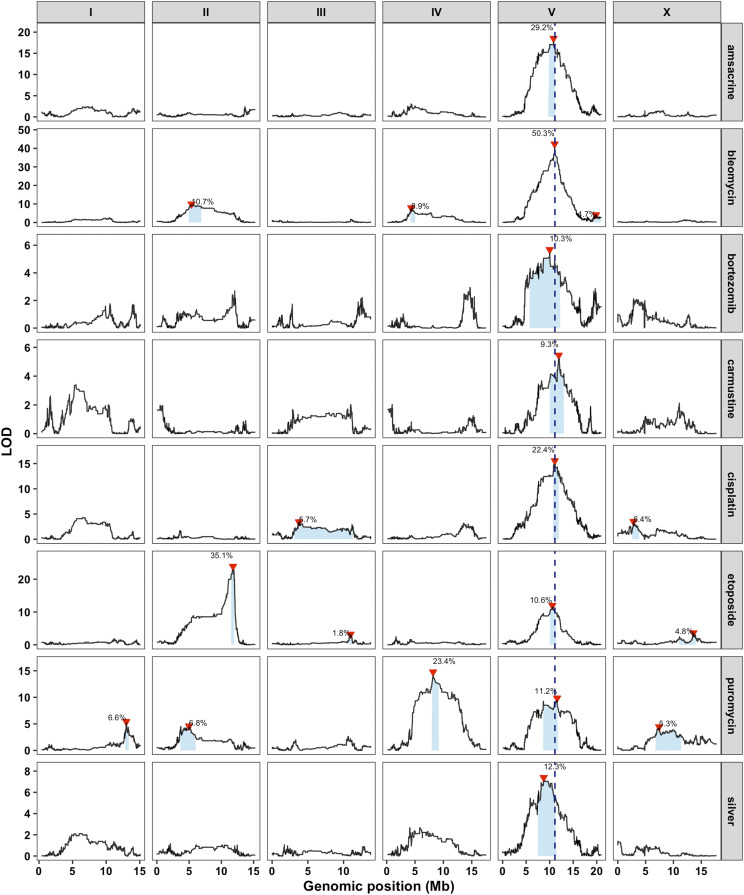
Figure 1.
A large-effect QTL on the center of chromosome V underlies responses to several chemotherapeutics. Linkage mapping results with the set 2 RIAILs for a representative trait for each drug are shown (amascrine: median.norm.EXT, bleomycin median.TOF:, bortezomib: median.TOF, carmustine: norm.n, cisplatin: median.TOF, etoposide: norm.n, puromycin: median.TOF, silver: median.TOF). Genomic position (x-axis) is plotted against the logarithm of the odds (LOD) score (y-axis) for 13,003 genomic markers. Each significant QTL is indicated by a red triangle at the peak marker, and a blue rectangle shows the 95% confidence interval around the peak marker. The percentage of the total variance in the RIAIL population that can be explained by each QTL is shown above the QTL. The dotted vertical line represents the genomic position of scb-1.

