Figure 3.
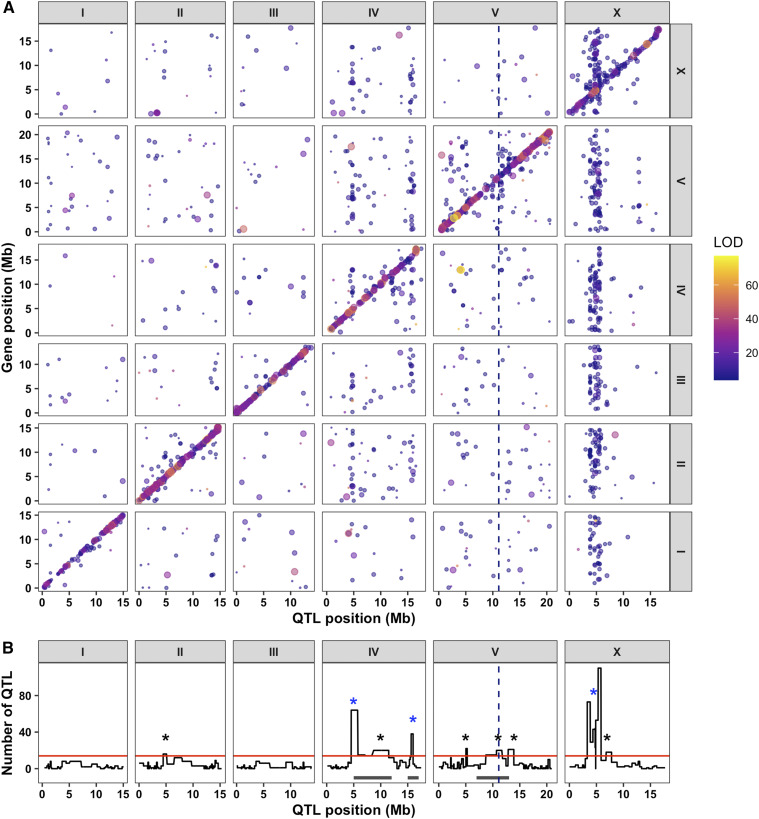
Expression QTL mapping identifies several hotspots. (A) The genomic locations of the eQTL peaks derived from linkage mapping using the set 1 RIAILs (x-axis) are plotted against the genomic locations of the probe (y-axis). The size of the point corresponds to the effect size of the QTL. eQTL are colored by the LOD score, increasing from purple to pink to yellow. The diagonal band represents local eQTL, and vertical bands represent eQTL hotspots. (B) Quantification of eQTL hotspots identified by overlapping distant eQTL. The number of distant eQTL (y-axis) in each 5 cM bin across the genome (x-axis) is shown. Bins above the red line are significant and marked with an asterisk. The bins with the blue asterisks are most significant and have been identified in a previous analysis. The dotted vertical line represents the genomic position of scb-1. Gray rectangles below the plot represent locations of the drug-response QTL hotspots previously identified.

