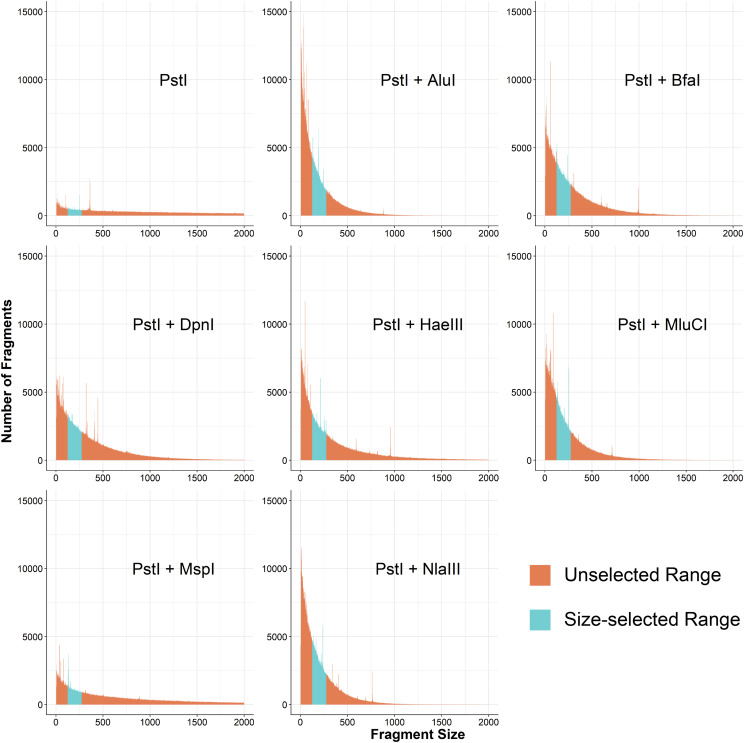
Figure 2.
In silico digest fragment distributions for PstI and potential secondary restriction enzymes. Each panel represents an independent digest of rn6 with the listed enzyme(s). Regions highlighted in blue are fragments that would be selected by the Pippin Prep (125-275bps) after annealing adapters and primers (+125bps). These regions are quantified in Table 1 by multiplying the length of the fragments by the number of fragments to estimate the portion of the genome captured.

