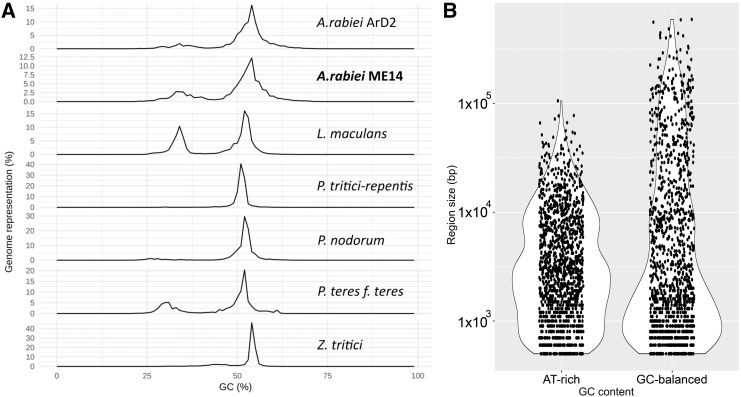
Figure 3.
Summary of genome compartmentalisation into GC-equilibrated and AT-rich regions of the A. rabiei genome assemblies. (A) GC content (%) distribution for Dothideomycete genome assemblies as calculated by OcculterCut (Testa et al. 2016). (B) Size distributions of AT-rich and GC-balanced regions for A. rabiei ArME14 (note logarithmic scale).

