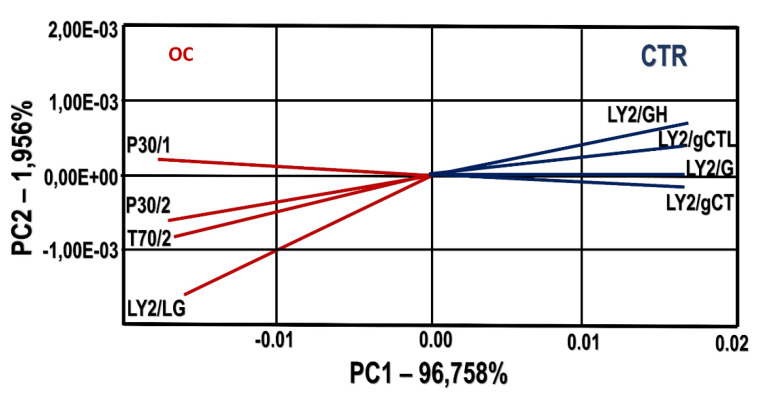
Figure 3.
Principal Components Analysis (PCA) with the loading of selected sensors for the cheese samples. CTR group: five cheese wheels after 60 days of ripening obtained from the milk of dairy cows fed concentrate without olive cake supplements. OC group: five cheese wheels after 60 days of ripening obtained from the milk of dairy cows fed concentrate with olive cake supplements. LY2/GH, LY2/gCTL, LY2/gCT, LY2/G are the selected sensors involved for CTR group and LY2/LG, P30/1, T70/2, P30/2 are the selected sensors involved for OC group. Discrimination index = 74. The two principal components (PC1 and PC2) are responsible for 98.71% of the variation showed by sensor’s signals used as loadings. The loading length of a trait measures the magnitude of its effect (positive or negative).

