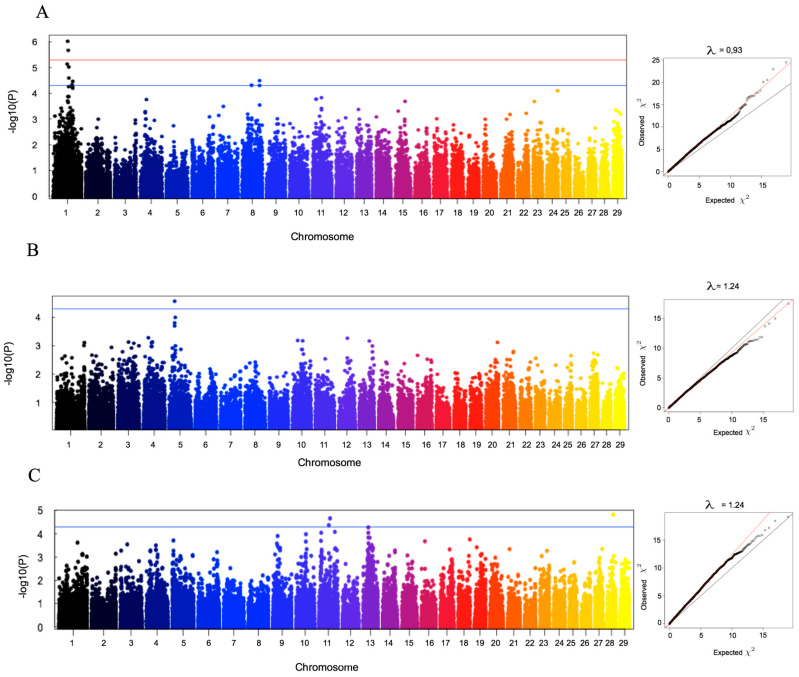
Figure 6.
Manhattan plot for single SNP GWAS with correction for population structure. (A) Longevity; (B) age at first calving; (C) direct genetic effect for calf weight at 4 months. The red and blue horizontal lines correspond to genome-wide significant and suggestive thresholds, namely adjusted-p-value = 0.000005 and adjusted-p-value = 0.00005, respectively. Q-Q plots generated to assess the reliability of the detected associations are shown for each analyzed trait along with the corresponding deflation factor (λ).

