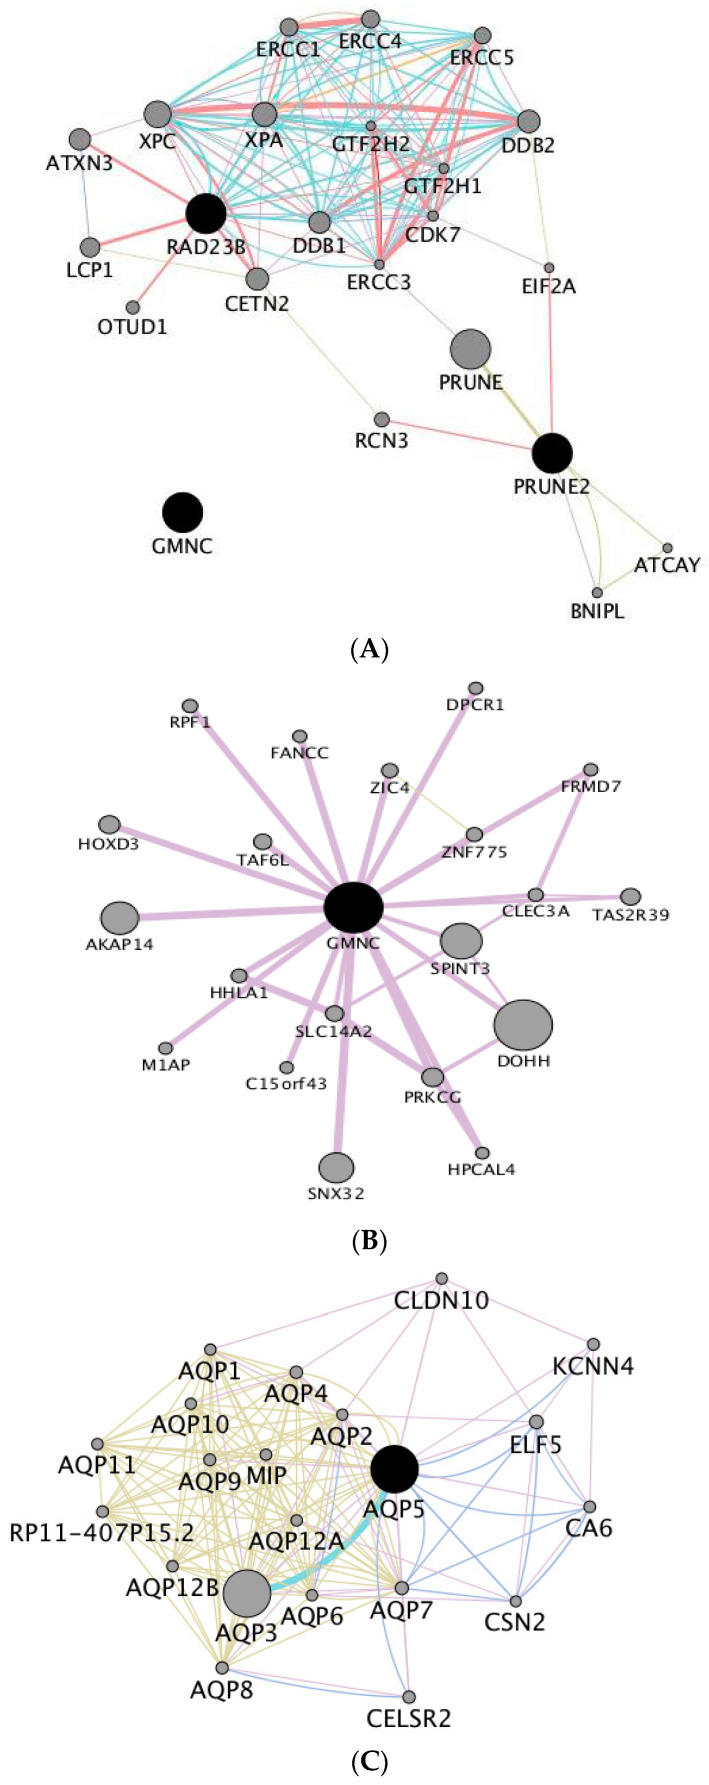
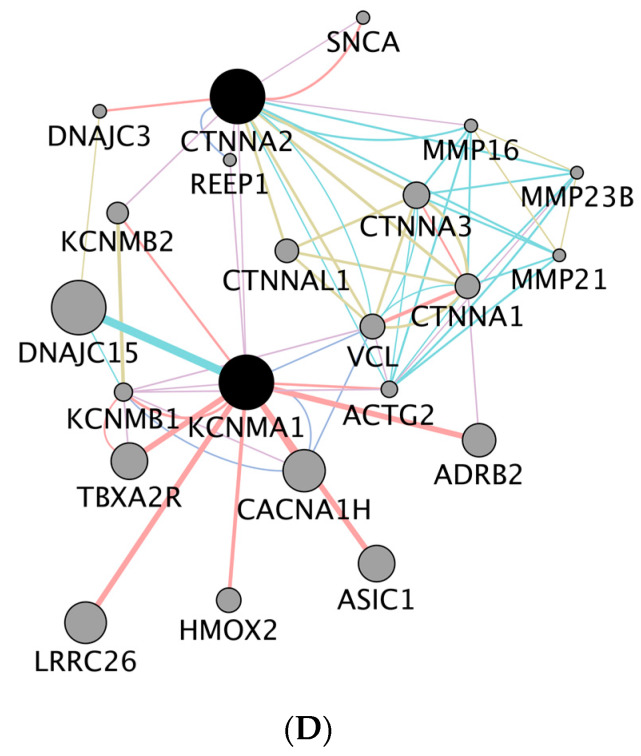
Figure 7.
Gene networks constructed based on the candidate genes overlapping significant SNPs for the studied traits. (A) Genes associated with longevity; (B) GMNC interaction network; (C) genes associated with age at first calving; (D) genes associated with direct genetic effects for calf weight at four months. Circles represent network nodes connected by lines (edges). The size of the nodes depends on their level of connectivity in the network (as more edges result in a larger circle size). On the other hand, edges with thicker line weights correspond to gene-gene interactions with stronger support by the literature.


