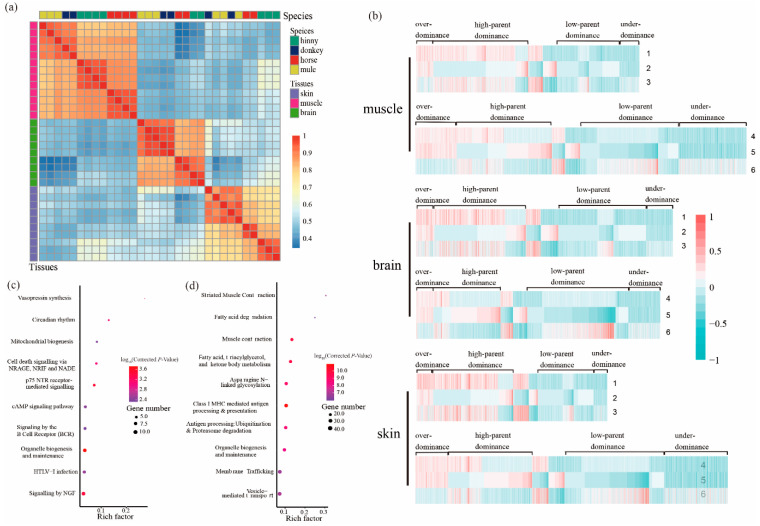
Figure 2.
Genes with DAS events in the tissues of muscle, brain, and skin from mule, hinny, and their parents. (a) Pearson’s correlation coefficient of the PSI (percent spliced-in) of genes with DAS events in different tissues. The gene clustered results of DAS events among species are shown on the top of the plot, while the clustered results of genes with DAS events among tissues are shown on the right side of the plot. (b) Hierarchical clustering display of DAS genes with the ratio of intensity according to expression patterns for horse, donkey, mule, and hinny. The color scale is shown at the top and the mode of gene action is shown on the side. Lane 1 represents intensity ratios of mule to horse; Lane 2, intensity ratios of mule to donkey; Lane 3, intensity ratios of horse to donkey; Lane 4, intensity ratios of hinny to horse; Lane 5, intensity ratios of hinny to donkey; Lane 6, intensity ratios of horse to donkey. (c) Kyoto Encyclopedia of Genes and Genomes (KEGG) pathways enriched by the genes that follow the hypothesis of over-dominance. (d) KEGG pathways enriched by genes that follow the hypothesis of dominance.

