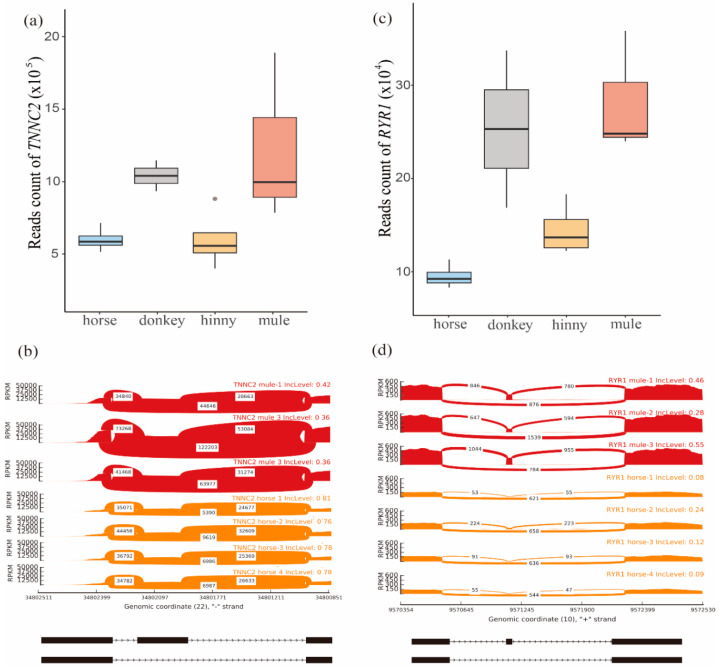
Figure 4.
Analysis of TNNC2 and RYR1 genes. (a) Distribution of reads mapped on the TNNC2 gene in muscle tissue of mule, hinny, and their parents. (b) Sashimi plot of the TNNC2 gene showing DAS events in mule muscle tissue. (c) Distribution of reads mapped on the RYR1 gene in muscle tissues of mule, hinny, and their parents. (d) Sashimi plot of RYR1 gene showing DAS events in the mule muscle tissue. Read densities supporting inclusion and exclusion of exons are shown.

