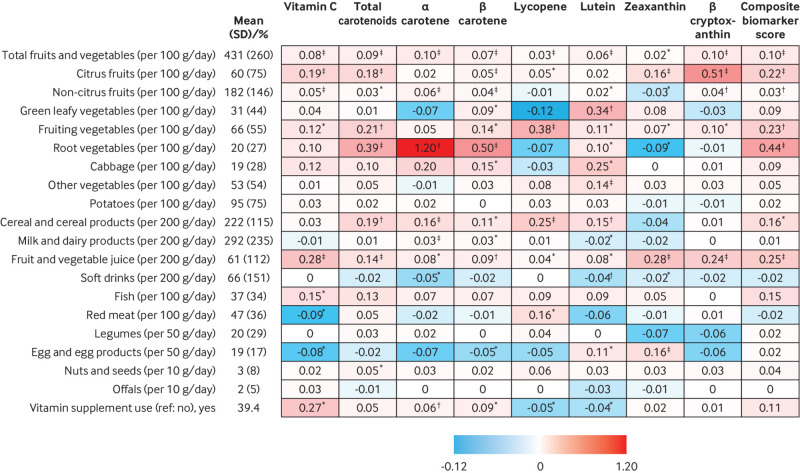
Fig 1.
Association of dietary factors with plasma vitamin C and carotenoids in the subcohort of the European Prospective Investigation into Cancer and Nutrition (EPIC)-InterAct study. The values in the box represent the differences in vitamin C, carotenoids, or the composite biomarker score (in standard deviaiton units) for each one standardised unit per category difference in dietary factors. The mean (standard deviation) or percentage of participants for the examined dietary factors are presented in the second column. Linear regression was used to obtain the country specific estimate of an association, adjusting for demographic, lifestyle, and other examined dietary factors if available in that country, except the overlapping food groups. The country-specific estimates were then combined using random effects meta-analysis. *P<0.05; †P<0.001; ‡P<0.0001. Sample size was 10 584 for vitamin C and 11 537 for the carotenoid estimation. All the values are expressed in a red scale for different levels of positive associations and blue scale for different levels of negative associations. All the carotenoids variables were natural log transformed before statistical analysis in the linear regression. Standard deviation was 19.2 µmol/L for vitamin C, 0.50 for total carotenoids (log transformed), 0.91 for α carotene (log transformed), 0.73 for β carotene (log transformed), 0.68 for lycopene (log transformed), 0.51 for lutein (log transformed), 0.91 for zeaxanthin (log transformed), 0.94 for β cryptoxanthin (log transformed), and 0.57 for the composite biomarker score. A β coefficient of 0.10 represents the increase in the composite biomarker score per 100 g/day of fruit and vegetable intake. Performing this cross sectional analysis the other way round, every change in one standard deviation in the composite biomarker score was associated with a 66 g/day increase in fruit and vegetable intake

