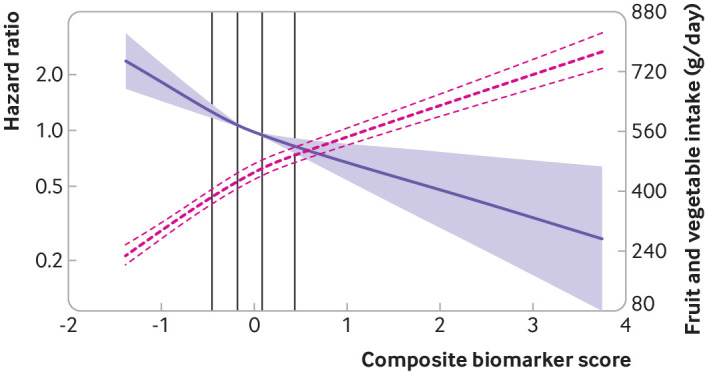
Fig 3.

Associations of plasma composite biomarker score with incident type 2 diabetes and total fruit and vegetable intake in the European Prospective Investigation into Cancer and Nutrition (EPIC)-InterAct Study. The purple solid line and shaded areas represent hazard ratios and 95% confidence intervals for the association of the composite biomarker score with type 2 diabetes (median as a reference), adjusted for age (as underlying time scale), sex, centre, physical activity, smoking status, employment, marital status, education, alcohol intake, total energy intake, high density lipoprotein cholesterol, low density lipoprotein cholesterol, body mass index, and waist circumference. The red dashed lines represent the association of the composite biomarker score with fruit and vegetable intake (best estimates and their 95% confidence intervals), adjusted for age, sex, centre, physical activity, smoking status, employment, marital status, education, alcohol intake, total energy intake, body mass index, waist circumference, and dietary intake of potatoes, cereal and cereal products, milk and dairy products, fruit and vegetable juice, soft drinks, fish, red meat, legumes, egg and egg products, nuts and seeds, offals, and vitamin supplement use. P values for non-linearity were 0.056 for the hazard ratios, and <0.001 for estimates for fruit and vegetable intake. The vertical lines within the figure represent the quintiles (20th, 40th, 60th, and 80th centiles) of the composite biomarker score in the subcohort
