
Figure 4.
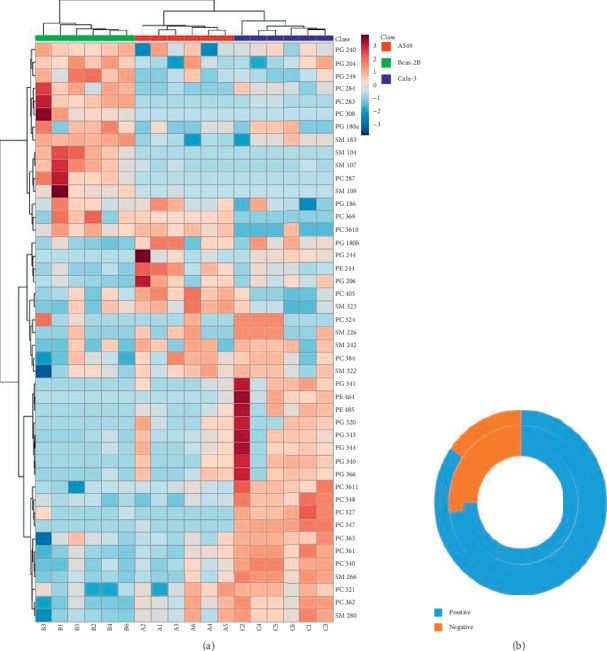
(a) The relative intensity of the phospholipids showing differences between the cell lines, obtained via positive-mode MALDI-TOF. (b) The relative percentage of positive and negative phospholipids deemed as significantly different between the outer leaflets of the three cell lines.