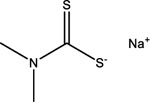
Table 2.
Outcomes of dimethyldithiocarbamates complexed with different metals in SBE-bla, WNT-, RAR-, SHH-luc assays.
| Sample Name | CASRN | Structure | SBE Antagonist | WNT Antagonist | RAR Antagonist | SHH Antagonist | ||||
|---|---|---|---|---|---|---|---|---|---|---|
| IC50 (μM) | Efficacy (%) | IC50 (μM) | Efficacy (%) | IC50 (μM) | Efficacy (%) | IC50 (μM) | Efficacy (%) | |||
| Ferbam | 14484-64-1 | 0.05 | −80.99 | 0.57 | −66.42 | 0.83 | −93.29 | 0.05 | −87.88 | |
| Ziram | 137-30-4 |  |
0.52 | −93.60 | 0.85 | −81.79 | 1.39 | −106.31 | 0.42 | −92.50 |
| Sodium dimethyldithiocarbamate | 128-04-1 |  |
9.14 | −68.19 | Inactive | Inactive | 17.37 | −93.31 | 6.73 | −87.30 |
Potency (IC50) and efficacy (activity %) in inhibiting TGFβ WNT, RAR, and SHH pathways by ferbam, ziram, and sodium dimethyldithiocarbamates were compared in the table.
